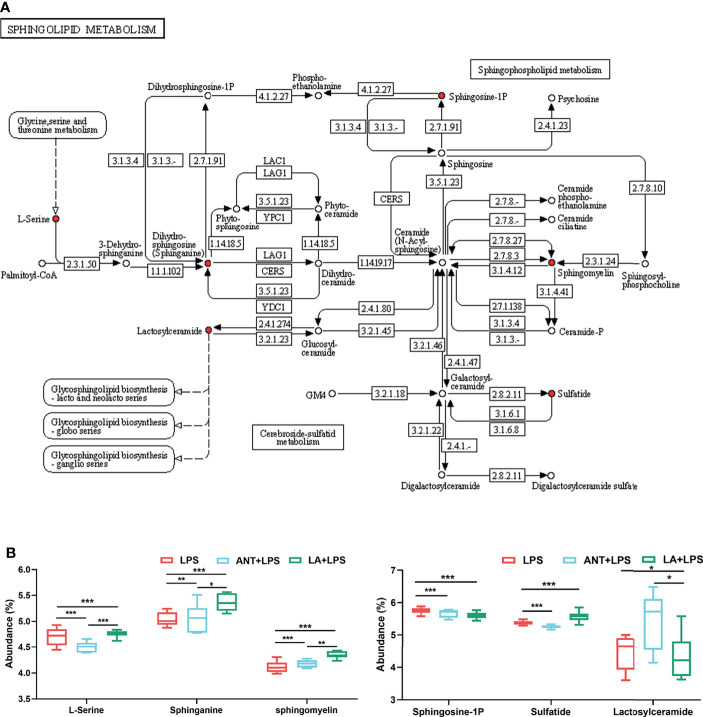
Figure 4.
Analysis of Sphingolipid metabolism pathway. LPS: fed with a basal diet and injected with 0.5 mg/kg LPS; ANT+LPS: fed with a basal diet supplemented with 75 mg/kg ANT, and injected with 0.5 mg/kg LPS; LA+LPS: fed with a basal diet supplemented with 1000 mg/kg LA, and injected with 0.5 mg/kg LPS. N=6 in each group. (A) Kyoto Encyclopedia of Genes and Genomes (KEGG) pathway map of Sphingolipid metabolism (map00600). The red nodes represent the differential metabolites. (B) Analysis of the differential metabolites by one-way ANOVA and Tukey’s test. *P < 0.05, **P < 0.01, ***P < 0.001.

