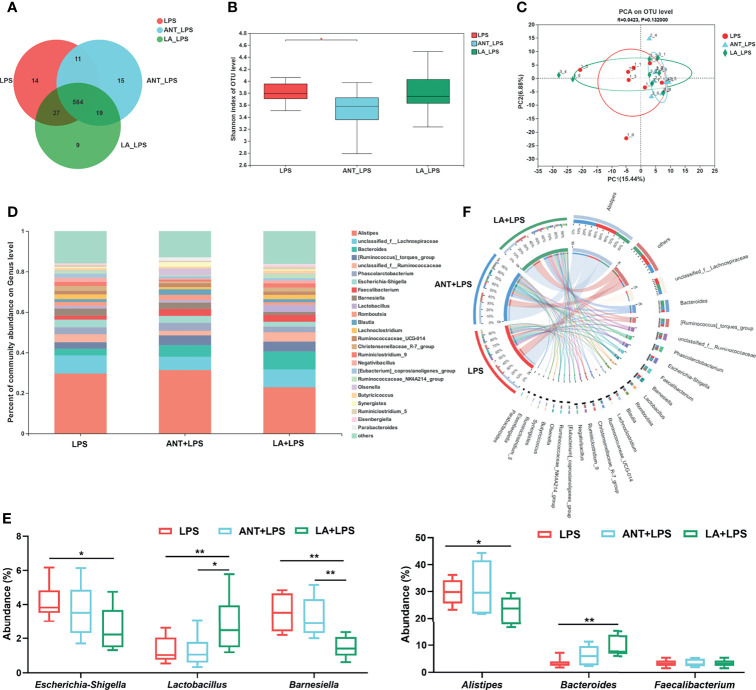
Figure 5.
Analysis of the diversity and composition of gut microbiota. LPS: fed with a basal diet and injected with 0.5 mg/kg LPS; ANT+LPS: fed with a basal diet supplemented with 75 mg/kg ANT, and injected with 0.5 mg/kg LPS; LA+LPS: fed with a basal diet supplemented with 1000 mg/kg LA, and injected with 0.5 mg/kg LPS. N=8 in each group. (A) Venn diagram presenting the operational taxonomic units (OTUs) from each group. (B) Shannon index of OTU level reflecting the α diversity. (C) β diversity shown in a Principal component analysis (PCA) scatterplot. (D) Bar graph of microbial composition at the genus level. (E) Box plot of the significant genera among groups. (F) Circos diagram indicating the dominant genera in each group. The data were analyzed by one-way ANOVA and Tukey’s test. *P < 0.05, **P < 0.01.

