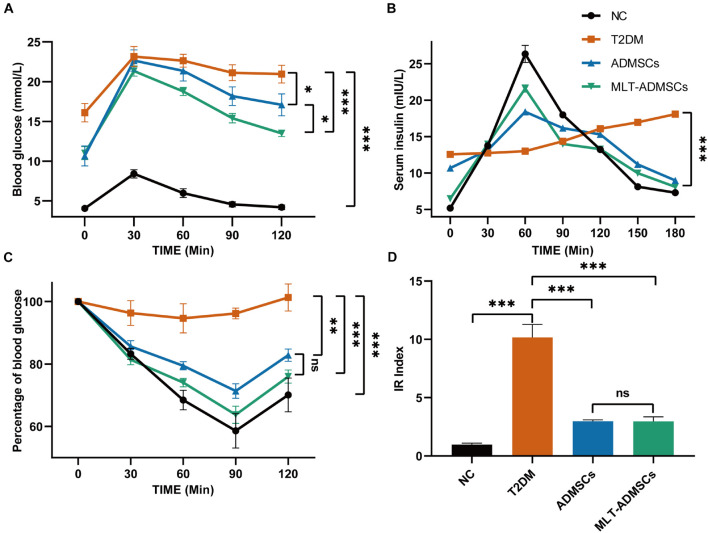
FIGURE 3.
MLT enhances the recovery effect of ADMSCs on insulin resistance in T2DM mice. (A) OTGG. (B) IRTs. (C) IPITT. (D) IR index in each group, HOMA-IR index = [FBG (in mmol/L) × FINS (in units/L)]/22.5. The blood glucose level in each group was detected after fasting for 3 h. Values in this figure are the mean ± SE; n = 10 mice per group; ns > 0.05, ∗p < 0.05, ∗∗p < 0.01, ∗∗∗p < 0.001 determined by a repeated-measures ANOVA.

