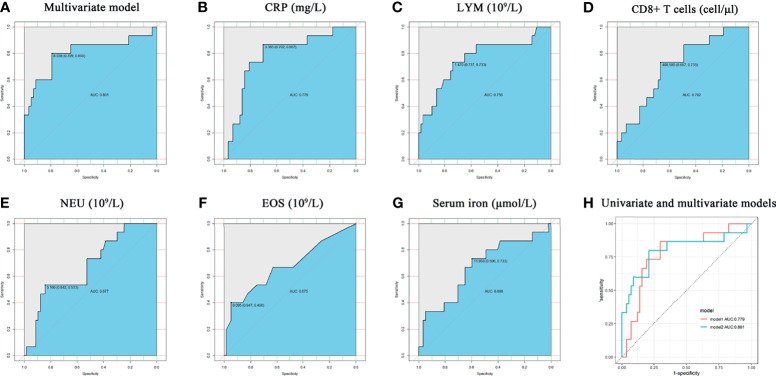
Figure 2.
Non-parametric ROC analysis of meaningful variables. (A–G) the model combining NEU and LYM counts, CRP, LYM counts, CD8+ T cell counts, NEU counts, EOS counts, and serum iron. all P < 0.05. (H) Comparison between ROC curves for CRP univariate model and multivariate model combining NEU and LYM counts. Model1 represents the CRP univariate model, and model2 represents the multivariate model combining NEU and LYM counts. ROC, Receiver operating curves.

