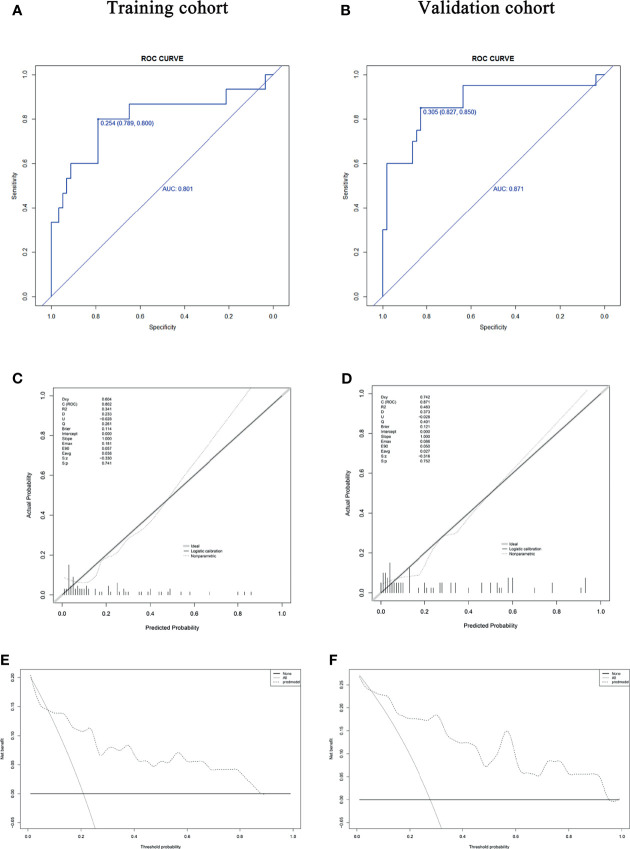
Figure 3.
The diagnostic value, concordance, and clinical relevance of the diagnostic model. (A, B) The AUC indicates the discriminatory performance of the diagnostic model in the training and validation cohorts. (C, D) Calibration test of the diagnostic model in the training and validation cohorts. The fitting curve by regression analysis (black solid line) approximates the standard curve (gray line), with no significant difference (P = 0.741 and P = 0.752, respectively). (E, F) DCA of the training and validation cohorts. DCA showed more benefit from using the diagnostic prediction model if the threshold probability was in the ranges of ≤ 2% and 8-87% in the training cohort and a higher overall net benefit if the threshold probability was in the ranges of ≤ 1% and 6-94% in the internal validation cohort. AUC, area under the curve; DCA, decision curve analysis.

