
Figure 1.
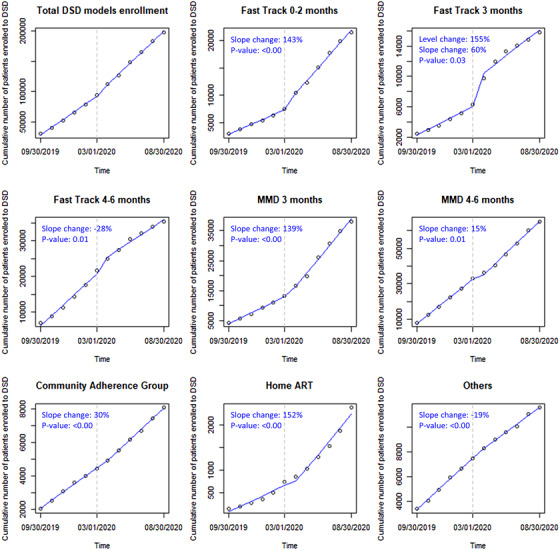
Interrupted time series scatter plot and slope lines for the DSD models before (September 2019 to February 2020) and after (March 2020 to August 2020) 1 March 2020 in Zambia. ART, antiretroviral therapy; DSD, differentiated service delivery; MMD, multi‐month dispensing.