Figure 3.
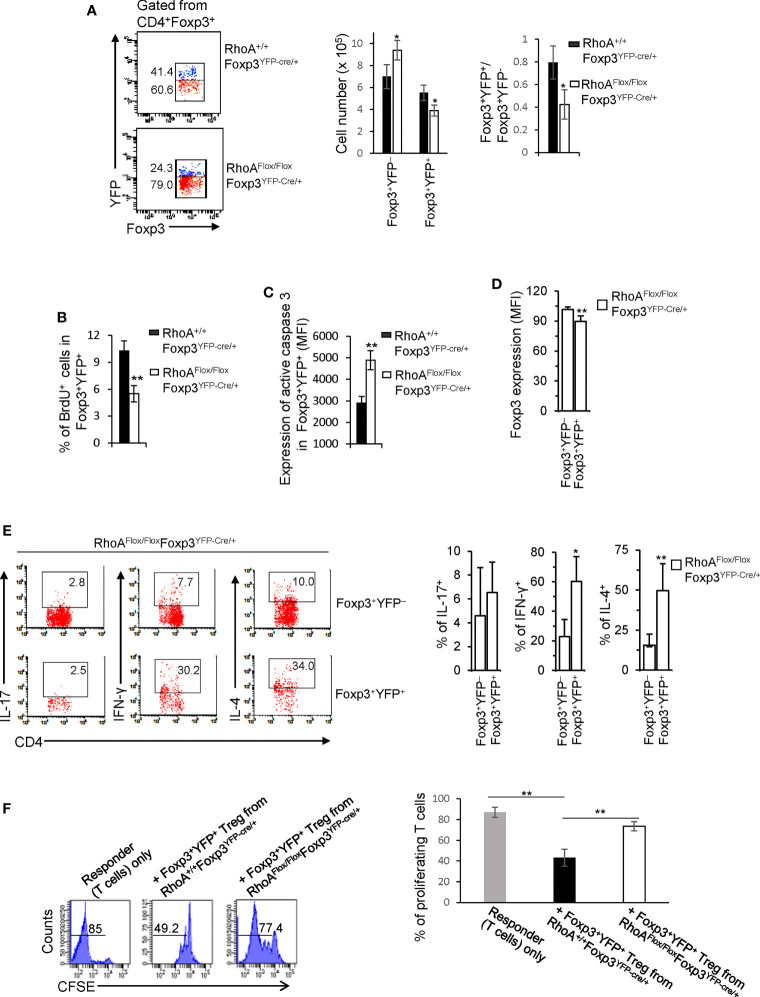
Treg cells bearing homozygous RhoA deletion are plastic and outcompeted by Treg cells bearing intact RhoA in RhoAFlox/FloxFoxp3YFP-Cre/+ female mice. (A) Left, representative flow cytogram of Foxp3+YFP+ and Foxp3+YFP- cells in CD4+Foxp3+ Treg cells from the spleen of RhoA+/+Foxp3YFP-Cre/+ and RhoAFlox/FloxFoxp3YFP-Cre/+ female mice. The numbers indicate percentages of Foxp3+YFP+ and Foxp3+YFP- cells. Middle, cell numbers of Foxp3+YFP+ and Foxp3+YFP- cells. Right, the ratio of percentages of Foxp3+YFP+ versus percentages of Foxp3+YFP- cells. (B) Foxp3+YFP+ Treg cell proliferation. (C) Foxp3+YFP+ Treg cell apoptosis. (D) The expression levels (MFI: Mean fluorescence intensity) of Foxp3 in Foxp3+YFP+ and Foxp3+YFP- cells from the spleen of RhoAFlox/FloxFoxp3YFP-Cre/+ female mice. (E) Left, representative flow cytogram of IL-17, IFN-γ, and IL-4 staining in CD4+Foxp3+YFP+ and CD4+Foxp3+YFP- cells from the spleen of RhoAFlox/FloxFoxp3YFP-Cre/+ female mice. The numbers indicate percentages of IL-17+, IFN-γ+, and IL-4+ cells. Right, average percentages of IL-17+, IFN-γ+, and IL-4+ cells. (F) In vitro Treg suppressive activity. Left, representative flow cytogram of CFSE dilution in T cells (responder). The numbers above the gating are percentages of cells low for CFSE, representing proliferating T cells. Right, average percentages of cells low for CFSE. Foxp3+YFP+ Treg cells were obtained by flow cytometry sorting of CD4+YFP+ cells from the spleen of RhoA+/+Foxp3YFP-Cre/+ and RhoAFlox/FloxFoxp3YFP-Cre/+ female mice. Error bars indicate SD of 3 mice (A–E) or triplicates (F). Data are representative of two independent experiments. *p < 0.05, **p < 0.01.

