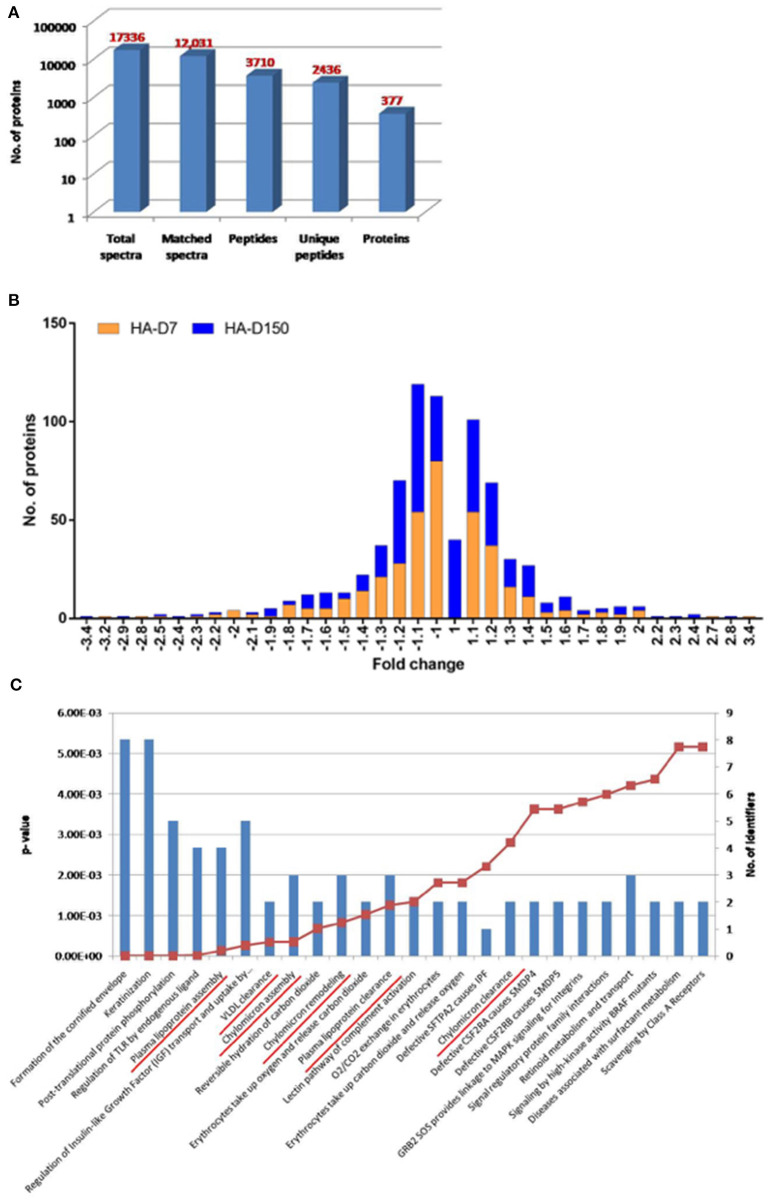
Figure 1.
TMT based plasma proteomics analysis. (A) Bar graph representing spectra, peptides, and proteins identified from TMT-based LC-MS/MS. (B) The quantitative ratio histogram of quantitative proteins identified in the study groups (HA-D7 and HA-D150 with respect to sea level). (C) Top 25 significant pathways for the identified common upregulated proteins in HA-D7 and HA-D150 groups representing a number of identified proteins along with their p-value. Underlined signify identified pathways involved in lipoprotein metabolism.

