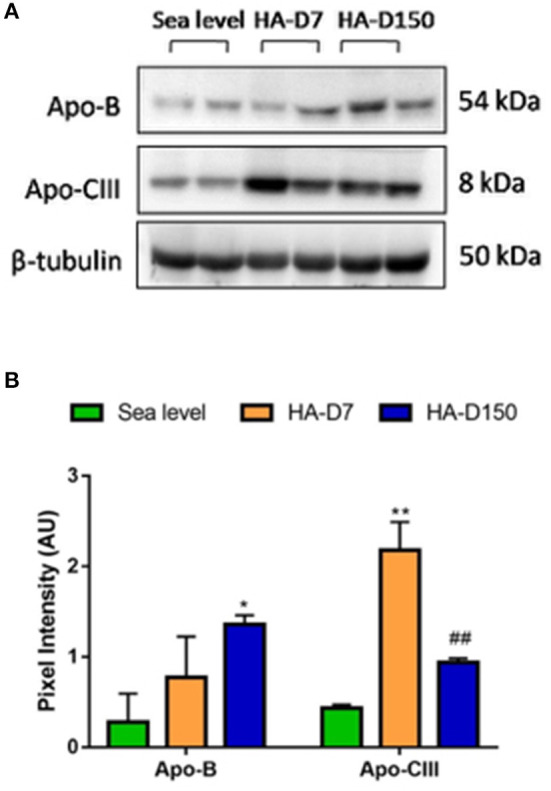
Figure 2.

Validation of plasma proteomics data (n = 6). (A) Western blot analysis of Apo-B and Apo-CIII along with tubulin as a loading control. (B) Densitometry analysis of Apo-B and Apo-CIII with respect to tubulin. *represents p < 0.05, **represents p < 0.01 with respect to sea level and ##represents p < 0.01 with respect to HA-D7.
