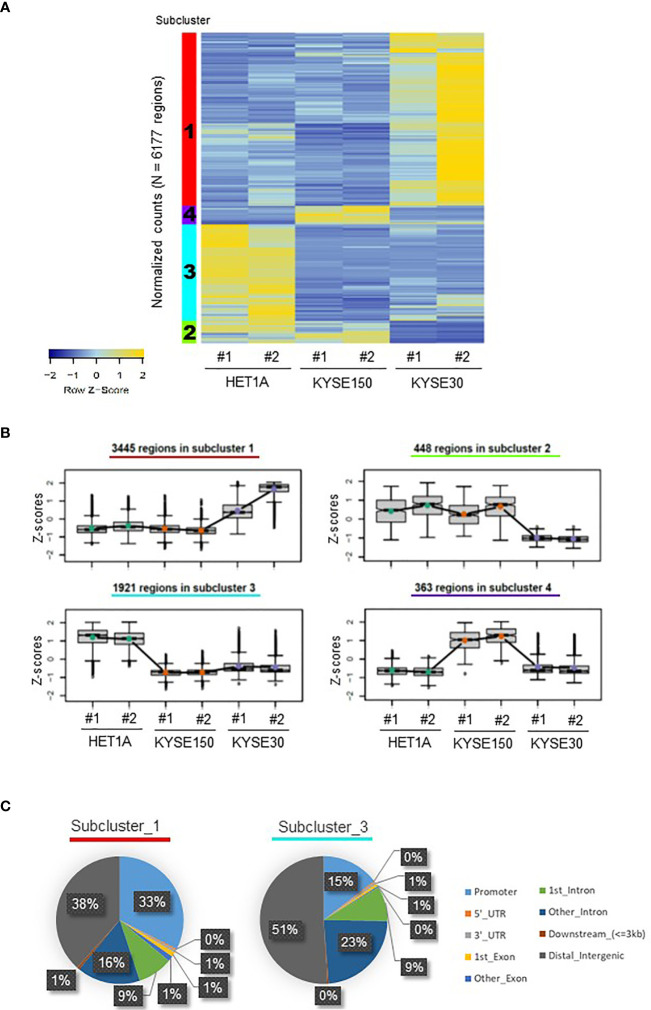
Figure 1.
Distribution of ATAC-seq peaks in HET-1A, KYSE-150, and KYSE-30 cells. (A) A heatmap of differentially accessible chromatin regions in each sample, hierarchically clustered into four subclusters of hyper- or hypo-accessible regions among cell lines. The subcluster numbers are shown in the left color-coded columns. (B) Different trends of chromatin accessibility in total 6,177 regions among cell lines. The number of annotated regions in each subcluster is provided. (C) ATAC-seq peaks in subclusters 1 and 3 were differently distributed in the regulatory and non-regulatory genomic regions. Decimal numbers were omitted.

