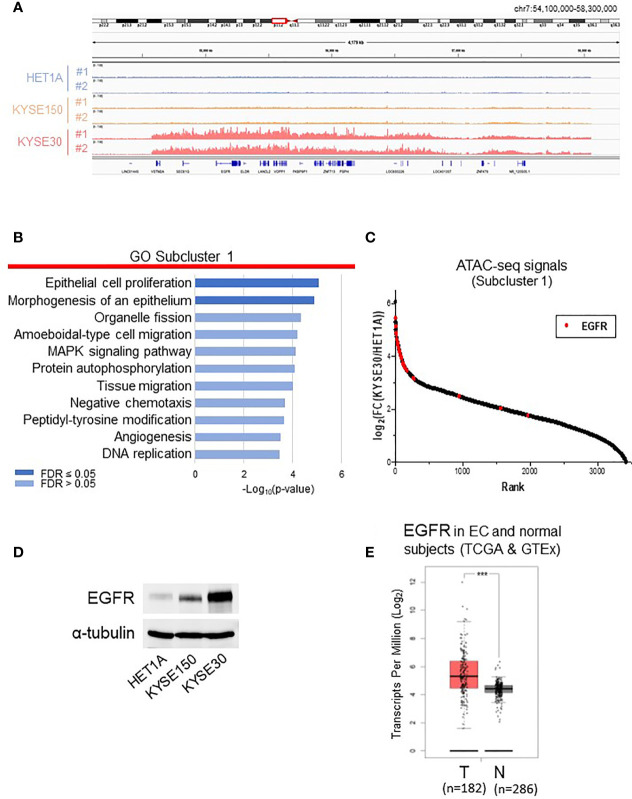
Figure 2.
Analyses of subcluster 1 that includes highly accessible chromatin regions in KYSE-30 cells. (A) Exemplary ATAC-seq peaks on chromosome 7 showed that these regions are hyper-accessible in KYSE-30 cells. (B) Differentially accessible regions in subcluster 1 were associated to the nearest genes, and functional enrichment analysis of this gene set shows various cell signaling pathways associated with cancer. (C) In subcluster 1 ATAC-seq peak set (n = 3445 peaks), the fold changes of peak frequencies in KYSE-30 versus HET-1A cells were calculated and ranked. The highest number of differential ATAC-seq peaks were found near the EGFR gene, and most of these peaks (28/31) were ranked within the top 10%. Red marks indicate the fold change of each EGFR-associated ATAC-seq peak (n = 31). (D) Representative Western blot showed that EGFR expression was upregulated in KYSE-150 and KYSE-30 cells. (E) EGFR gene had higher expression in tumors (T) than in neighboring tissues of esophageal cancer patients (TCGA data) or normal esophagus (GTEx data) (N). T = 182, N = 286; Log2FC >0.5; ***p-value < 0.001.

