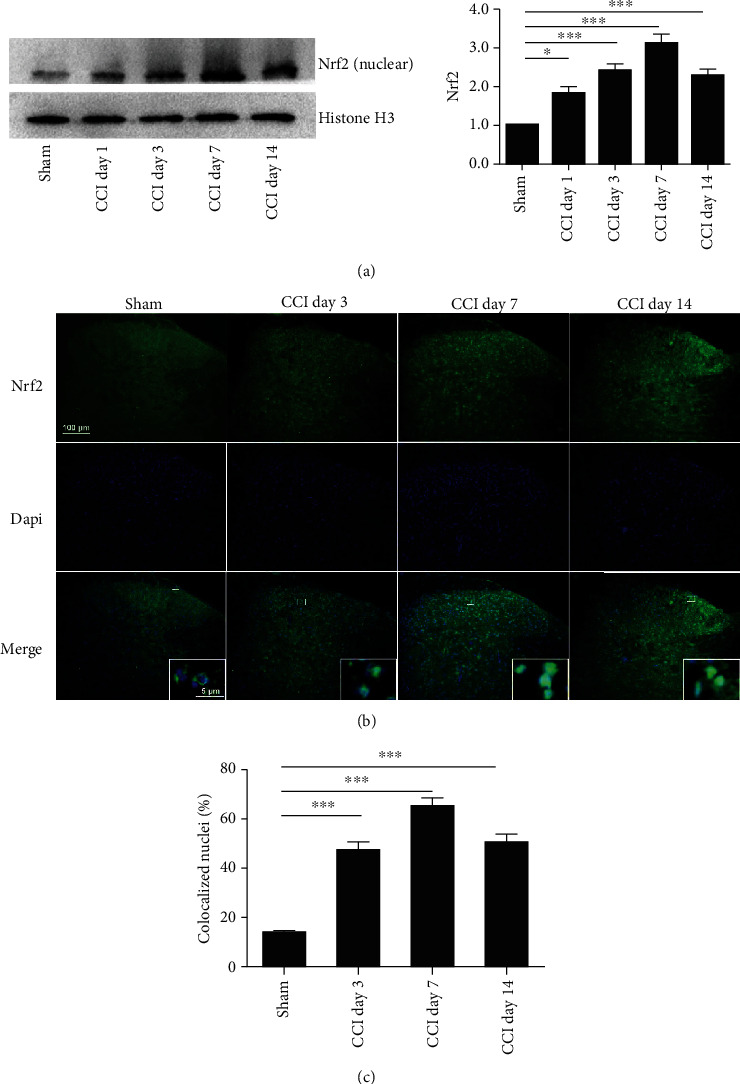
Figure 2.

Time course of Nrf2 expression in the spinal cord after CCI. (a) Western blotting showed the time course of Nrf2 protein in the nuclear extracts. Representative blots and blot density (normalized to histone H3 loading control) are presented (∗P < 0.05, ∗∗∗P < 0.001 compared with the sham group, n = 5 per group). (b) Representative fluorescent photomicrographs showed the time course expression of Nrf2 and nuclei in the ipsilateral spinal cord dorsal horn following CCI. One-way ANOVA followed by the Bonferroni post hoc test was used for western blot results and immunochemistry data. Magnification: 100x and 2000x (insets) (scale bar = 100 μm). (c) The number of DAPI-positive nuclei colocalized with Nrf2 is expressed as a ratio of the total number of nuclei in the spinal cord dorsal horn. One-way ANOVA followed by Bonferroni analysis was used to test the differences among groups (∗∗∗P < 0.001 compared with the sham group, n = 3 per group).
