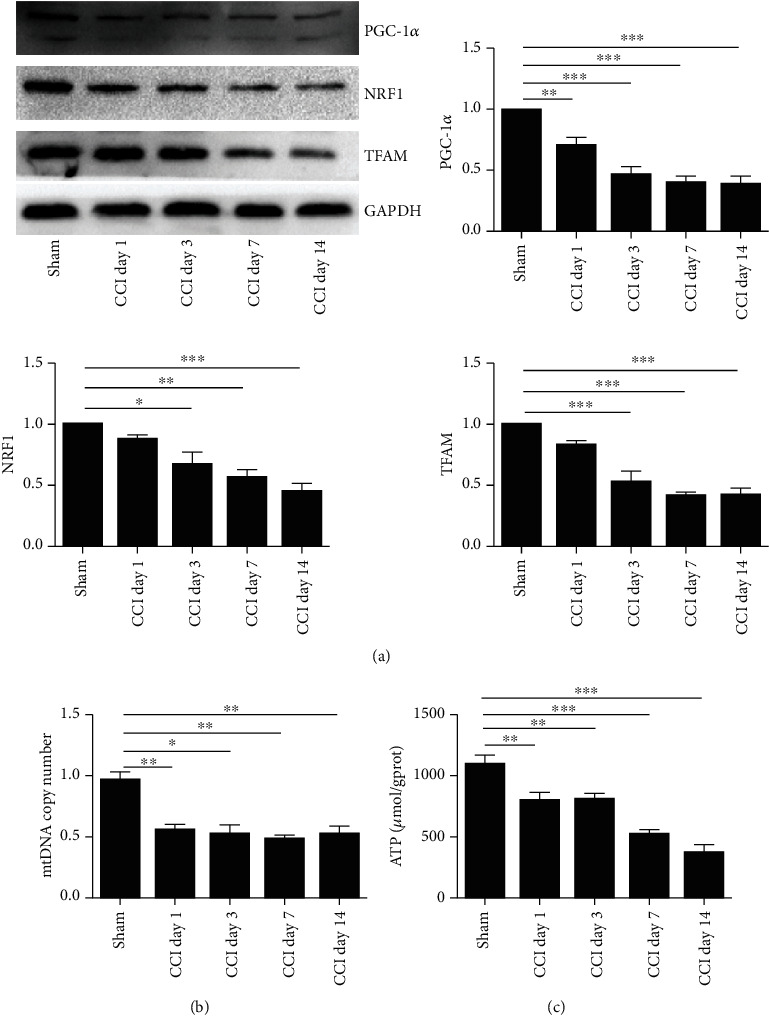
Figure 6.

Time course of mitochondrial protein and mtDNA content in the spinal cord following CCI. The spinal cord was collected and analyzed for (a) mitochondrial protein expression, (b) mtDNA content, and (c) ATP levels following CCI. The intensity of protein blots was normalized to loading control GAPDH antibody and expressed as the fold of control. One-way ANOVA followed by Bonferroni analysis was used to test the differences among groups (∗P < 0.05, ∗∗P < 0.01, and ∗∗∗P < 0.001 compared with the sham group).
