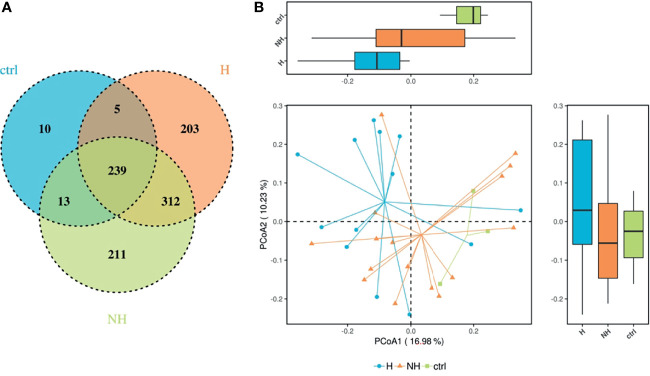
Figure 2.
Differential composition of gut microbiome in CRP patients. (A) Venn diagram representing the operational taxonomic units (OTUs) in samples obtained in healthy volunteers (crtl), CRP patients with hematochezia (H), and those without hematochezia (NH). (B) PCoA based on UniFrac matrix showing the differential microbiota composition. Boxes represent the 25th to 75th percentile of the distribution; the median is shown as a thick line in the box.

