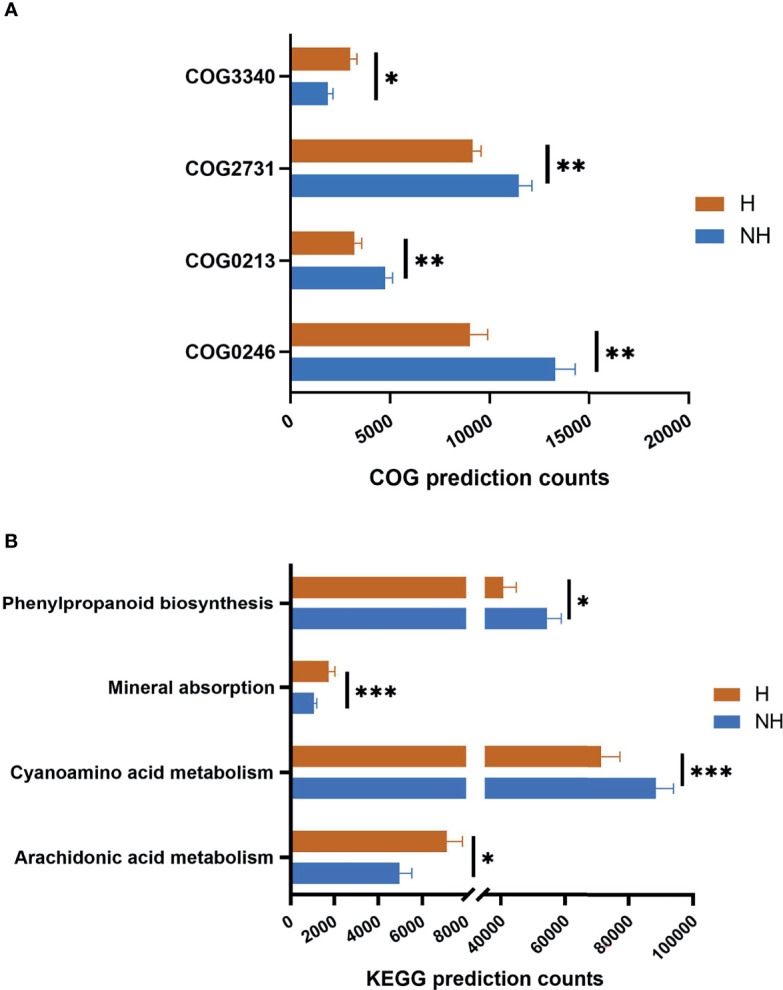
Figure 6.

The distribution of functional categories. The distribution of (A) COG and (B) KEGG function with significant difference between two groups. The column length represents the corresponding samples in this metabolic pathway, and the error bar represents the standard error of abundance. *p < 0.05, **p < 0.01, ***p < 0.001.
