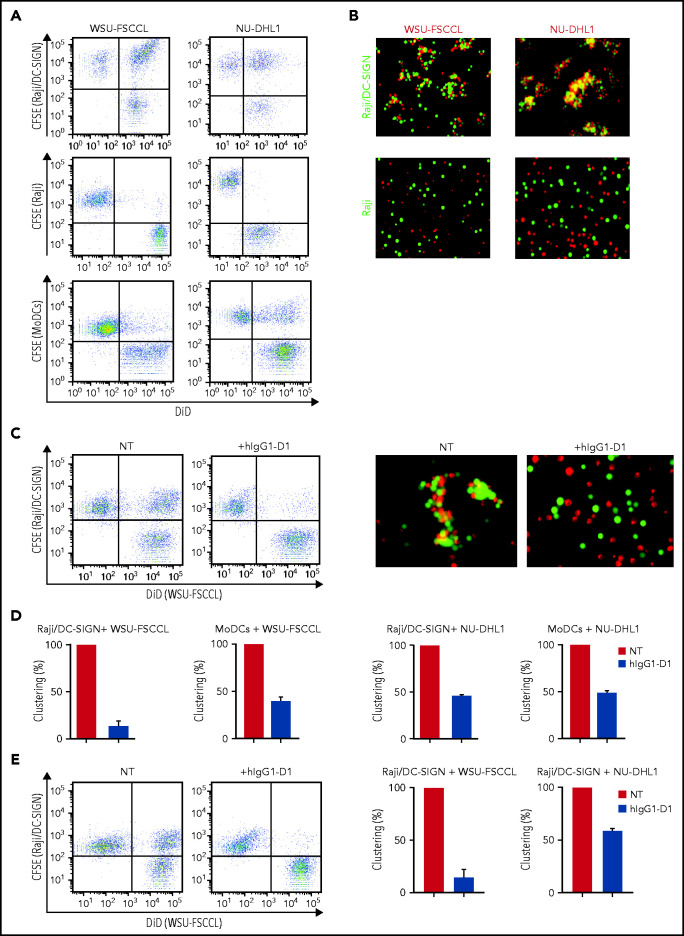
Figure 6.
The specific interaction of sIg-Mann+ lymphoma cells and DC-SIGN–expressing cells. (A-B) sIg-Mann+ lymphoma cells form clusters round DC-SIGN–expressing cells. (A) Flow cytometry analysis of clustering between sIg-Mann+ DLBCL lines (WSU-FSCCL or NU-DHL1) and Raji/DC-SIGN cells (top), parental Raji cells (middle), or MoDCs (bottom). (B) Inverted fluorescence microscopy images of clustering between sIg-Mann+ DLBCL lines (WSU-FSCCL or NU-DHL1) and either Raji/DC-SIGN (top) or Raji cells (bottom). (C-E) The interaction of sIg-Mann+ lymphoma cells and DC-SIGN–expressing cells is specifically inhibited or interrupted by the anti-DC-SIGN antibody hIgG1-D1. (C-D) Raji/DC-SIGN or MoDCs were treated with 10 nM hIgG1-D1 or left untreated (NT), before coculture with WSU-FSCCL or NU-DHL1. (C) Clustering of WSU-FSCCL with Raji/DC-SIGN was determined by flow cytometry (left) and inverted fluorescence microscopy (right). (D) Percent of clustering, as determined by flow cytometry in the presence or absence of hIgG1-D1 was calculated as (double-positive population) × 2/(2 × double-positive population + single-positive carboxyfluorescein diacetate succinimidyl ester (CFSE) + single-positive DiD). (E) Raji/DC-SIGN cells were cultured with WSU-FSCCL or NU-DHL1 for 30 minutes. HIgG1-D1 (10 nM) or medium (NT) was subsequently added to the coculture, and clustering was measured after 2 hours by flow cytometry. Clustering with WSU-FSCCL is shown. Data are represented as mean ± SEM of at least 2 independent experiments.

