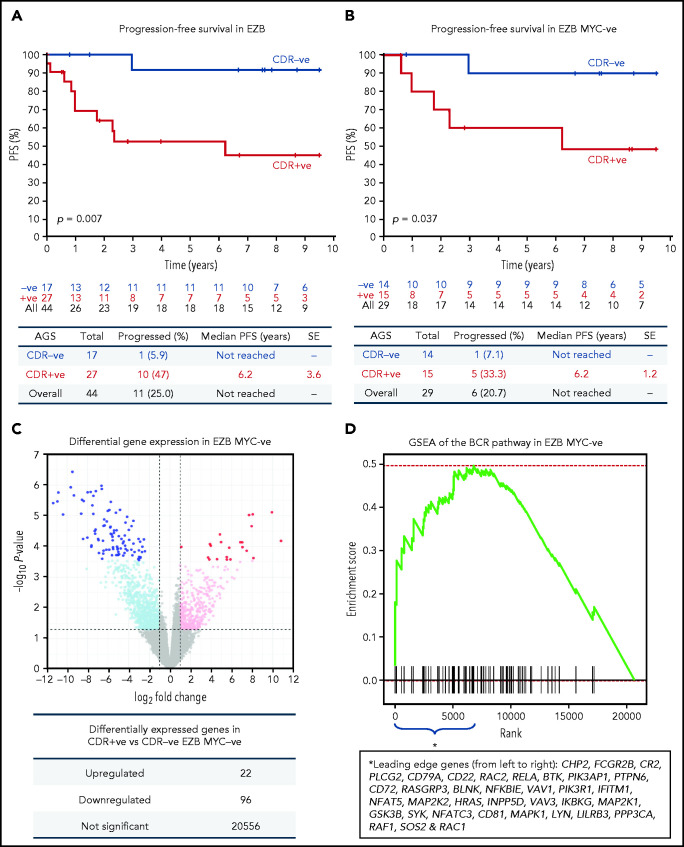
Figure 7.
Progression-free survival and gene expression profile of EZB lymphomas acquiring N-glycosylation sites in the CDR. (A-B) Progression-free survival (PFS) was determined by the Kaplan-Meier method using log-rank statistics. The number of patients at risk is indicated in blue (CDR–) or in red (CDR+) at each time point (years). (A) PFS in EZB GCB-DLBCL with N-glycosylation sites acquired in the CDR of the tumor Ig (CDR+) or not (CDR–). (B) PFS in CDR+ and CDR– EZB GCB-DLBCL without MYC translocation (EZB MYC–). (C-D) Differential gene expression and BCR gene set enrichment in CDR+ compared with CDR– EZB MYC– DLBCL. (C) Each point represents a gene and the fold change and P value for differential expression in CDR+ vs CDR– EZB MYC– DLBCL. CDR+ had higher expression of positive log2 fold changes, and CDR– had higher expression of negative log2 fold changes. Gray points were not differentially expressed genes. Light blue and magenta points were differentially expressed at P = .05, whereas blue and red points were differentially expressed at false discovery rate of 0.05 after controlling for multiple testing (Benjamini-Hochberg procedure). (D) Gene set enrichment analysis (GSEA) plot showing the enrichment of BCR signaling pathway genes in the log2 fold change ranked genes for CDR+ vs CDR–. Enrichment of the BCR pathway toward the beginning of the ranked list indicated that the BCR pathway was enriched in genes more highly expressed in CDR+ than in CDR– EZB MYC–. Leading-edge genes (ie, those observed on the left edge of the green curve) in the BCR pathway are listed in the same order as they appear on the x-axis.

