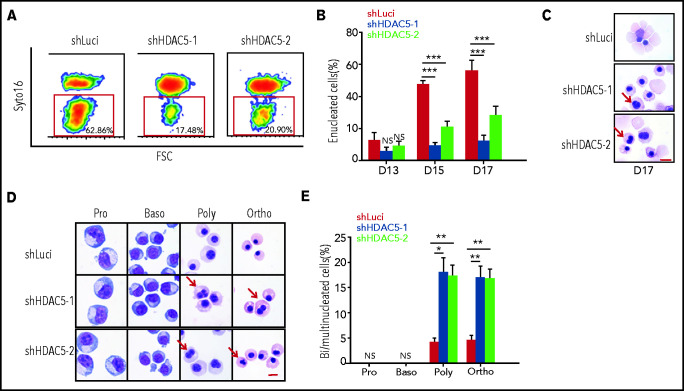
Figure 3.
Impaired enucleation and generation of abnormal nuclei after HDAC5 knockdown. (A) Representative profiles of enucleation as assessed by SYTO 16 staining on day 17 of culture. The enucleation percentage was calculated as the SYTO 16–negative cells in the total population. (B) Quantitative analysis of enucleation on the indicated days from 3 independent experiments. (C-D) Representative cytospin images of day 17 erythroblasts (C). Representative cytospin images of sorted distinct stages of erythroblasts (D). Red arrows indicate binucleated and multinucleated erythroblasts. Scale br, 10 μm. (E) Quantification of binucleated and multinucleated erythroblasts in sorted erythroblasts at the different developmental stages. (B, E) *P < .05; **P < .01; ***P < .001. Baso, basophilic erythroblasts; Ortho, orthochromatic erythroblasts; Poly, poly chromatic erythroblasts; Pro, proerythroblasts.

