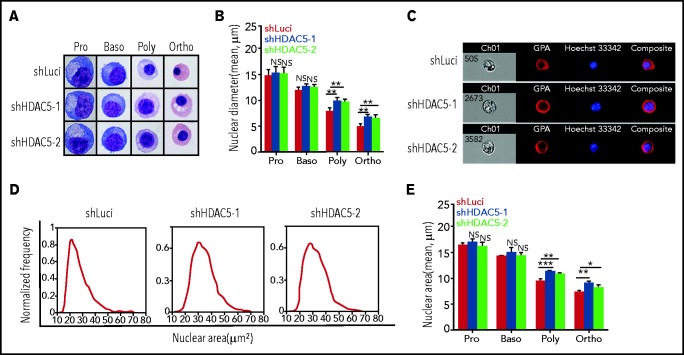
Figure 4.
Impaired chromatin condensation in HDAC5-knockdown polychromatic and orthochromatic erythroblasts. (A) Representative cytospin images of sorted erythroblasts stained with May-Grunwald-Giemsa. Scale bar, 10 μm. (B) Quantitative analysis of nuclear diameter of the sorted erythroblasts at the indicated stages. Cells (n = 1000) of each stage of terminal erythroid differentiation from 3 independent experiments were used for quantification. (C) Representative ImageStream images of orthochromatic erythroblasts stained with GPA and Hoechst 33342. (D) Representative ImageStream nuclear area profiles of orthochromatic erythroblasts. (E) Quantitative analysis of nuclear area of sorted erythroblasts from 3 independent experiments. *P < .05; **P < .01; ***P < .001. NS, nonsignificant. Baso, basophilic erythroblasts; Ortho, orthochromatic erythroblasts; Poly, poly chromatic erythroblasts; Pro, proerythroblasts.

