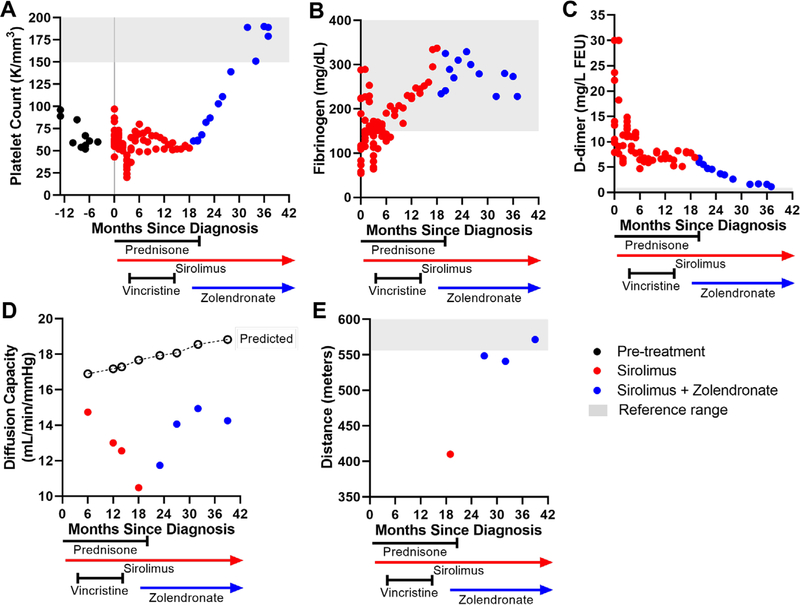
FIGURE 1.
Hematological, pulmonary, and physical function assessments of response to treatment. Panels (A)-(C) show platelet count (A), fibrinogen (B), and d-dimer (C) measurements in months relative to diagnosis (time 0) and over treatment course. Panel (D) shows pulmonary function test results of diffusion capacity of the lung for carbon monoxide relative to predicted (open circles). Panel (E) shows distance walked in meters during 6-min walk test. Initiation and duration of medications are denoted along x-axis. Normal reference ranges are indicated by gray shading

