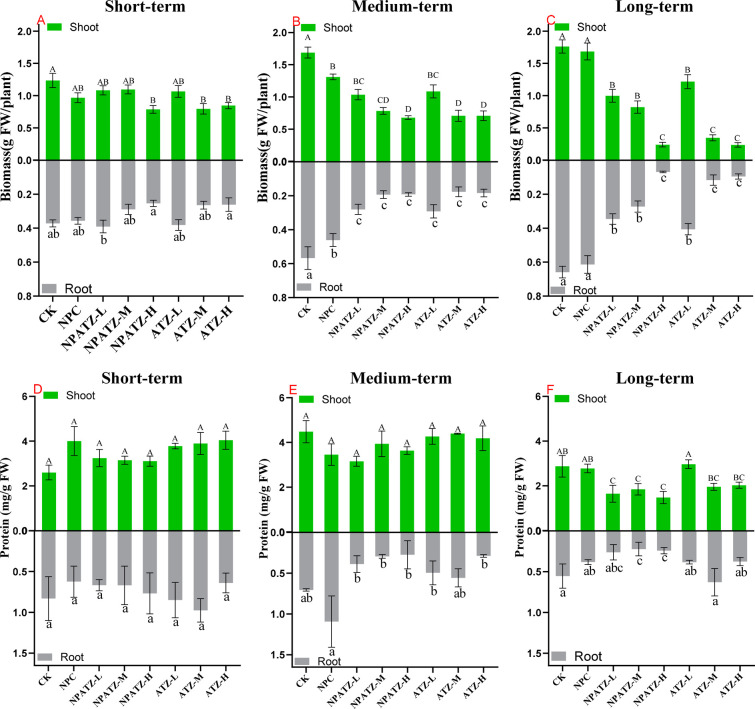
Figure 2.
Fresh biomass (A, B, C) of lettuce (L. sativa) and protein content (D, E, F) in lettuce (Lactuca sativa) exposed to NPATZ and ATZ with concentrations ranging from low, medium, to high and different exposure durations (short-, medium- and long-term). Data are mean ± SE (n = 3). The different letters indicate statistically significant differences between treatments within the same exposure duration by one-way ANOVA and Duncan’s honestly significant difference tests at α < 0.05 (capital letters for shoot tissues and lower-caseletters for root tissues). CK: control check, control plants without exposure to chemicals. NPC: exposure to a polymeric carrier without the ATZ (control). NPATZ-L: exposure to a low concentration of NPATZ. NPATZ-M: exposure to a medium concentration of NPATZ. NPATZ-H: exposure to a high concentration of NPATZ. ATZ-L: exposure to a low concentration of ATZ. ATZ-M: exposure to a medium concentration of ATZ. ATZ-H: exposure to a high concentration of ATZ.

