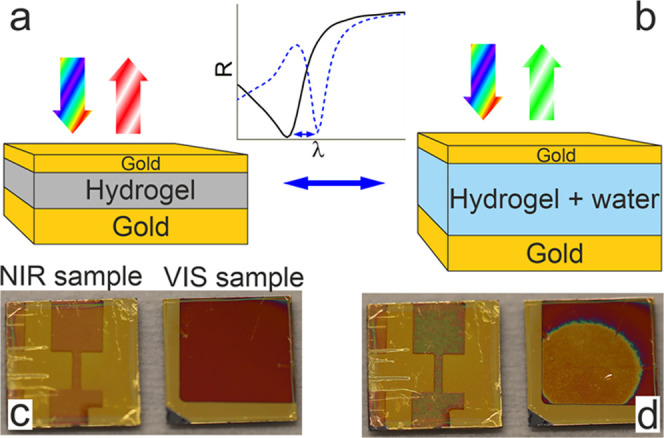
Figure 1.

Top: schematic of the hydrogel MIM reflective filter in (a) dry and (b) wet states. The inset graph illustrates the corresponding changes in the reflectance spectra between these two states. Bottom: images of the NIR and VIS samples in (c) dry and (d) wet states.
