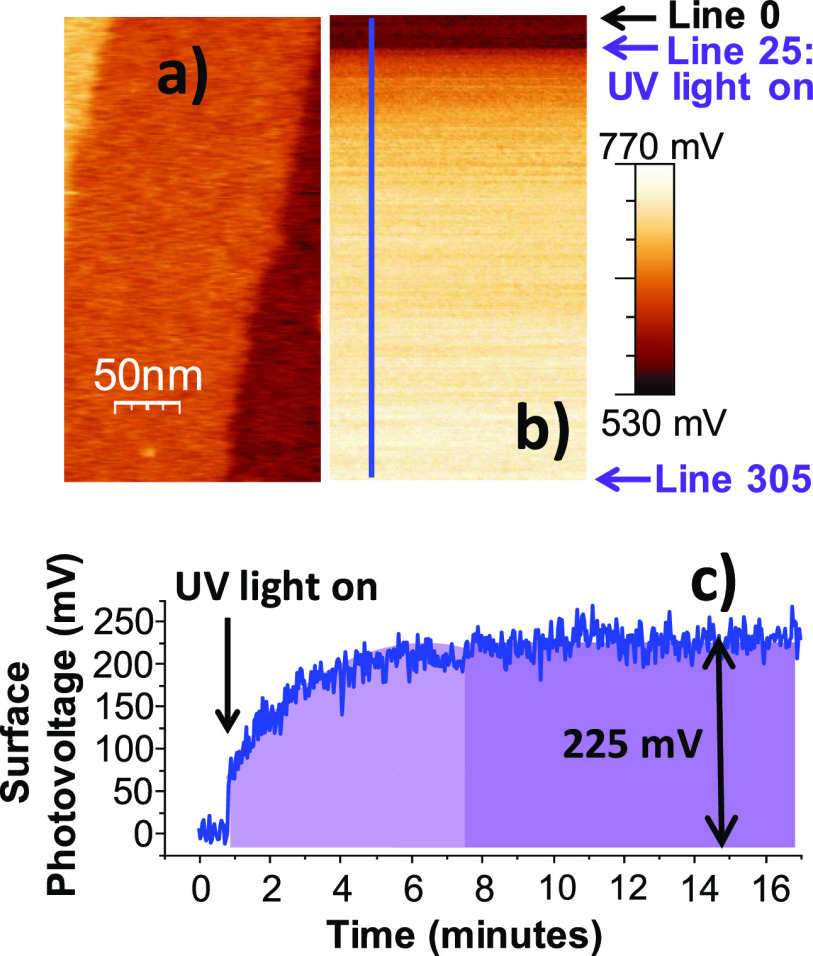
Figure 1.
(a) PA-KPFM topography (the color scale span: 1.83 nm) and (b) VCPD images of bare TiO2(110) acquired simultaneously. During the first minute, there was no UV illumination (lines 0 to 25). In the following lines, the UV illumination intensity was 0.40 mW/cm2. (c) Surface photovoltage (SPV = VCPD-light – VCPD-dark) vs time (profile along the blue line in b). A total increase of 225 mV is measured.

