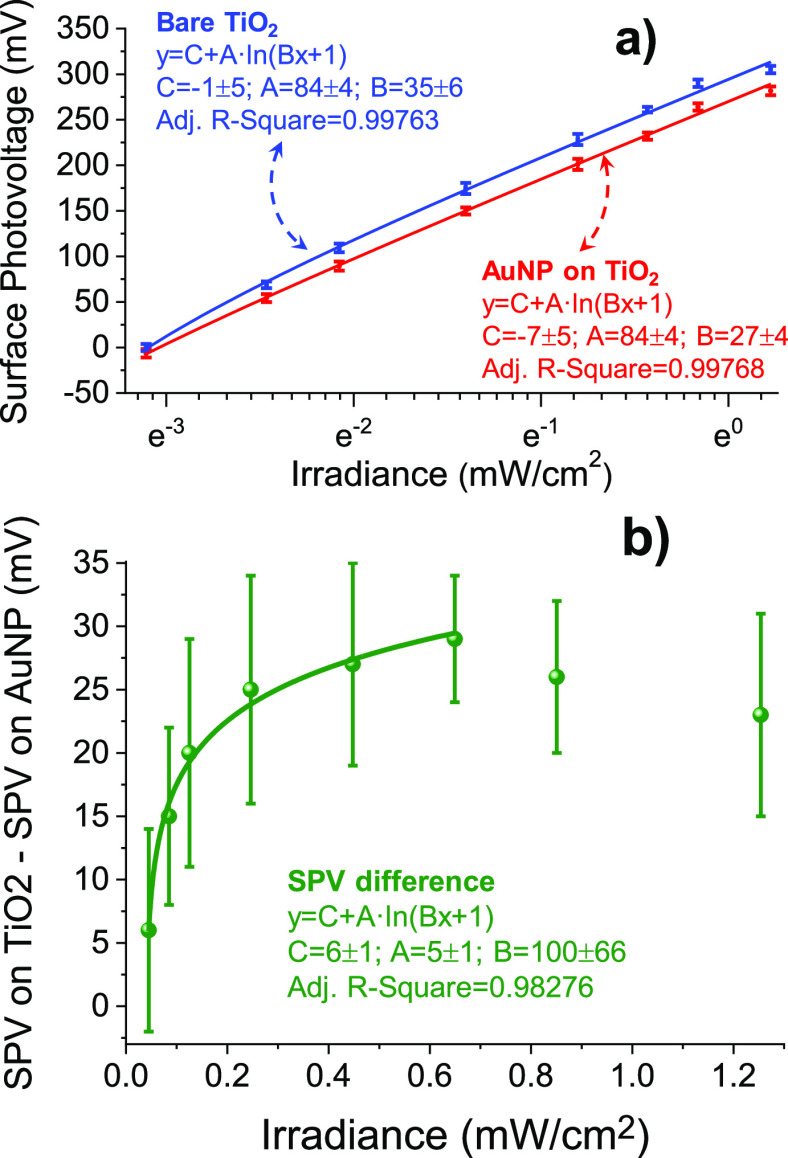
Figure 6.
(a) Surface PV vs irradiance with 365 nm wavelength light, with fits to the logarithmic functions for bare TiO2 (blue) and for the Au NP on the TiO2 (red). (b) Difference between SPV on bare TiO2 and SPV on the Au NP as a function of irradiance. The data in (a) is plotted with a logarithmic X-axis, while the data in (b) has a linear axis. The differences shown in (b) underestimate the real difference because the SPV on top of the Au NP averages with the value of the SPV on the surrounding area, as explained in Figure S6 of the Supporting Information.

