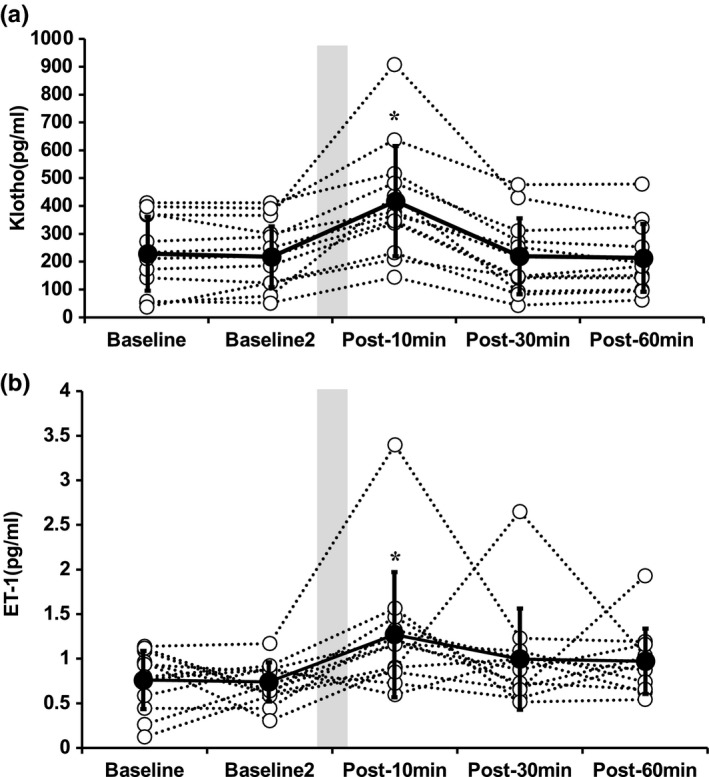
FIGURE 1.

Serum Klotho (A) and endothelin‐1 (B) concentrations before and after a single bout of resistance exercise. Data are expressed as means ±SD. A one‐way (time) repeated measures analysis of variance (ANOVA) with Tukey’s posthoc testing was performed (*p < 0.05 vs. Baseline). Open and closed circles indicate individual and average data, respectively. Shaded box indicates the duration of resistance exercise
