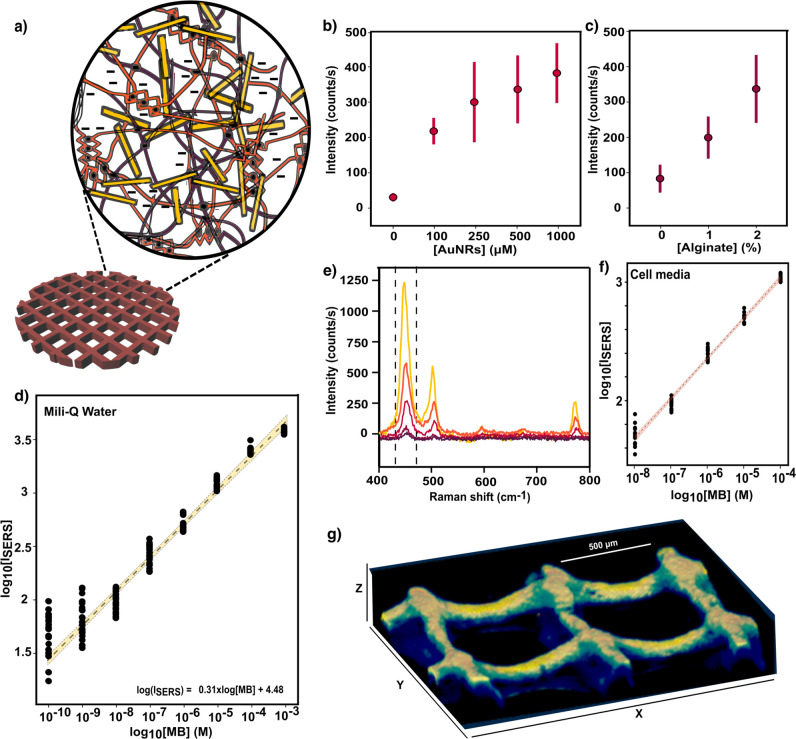
Figure 1.
(a) Scheme of a 3D-printed nanocomposite scaffold comprising gelatin and alginate hydrogels, represented by purple and orange fibers, respectively. The homogeneous distribution of gold nanorods (AuNRs) within the polymer matrix is represented by yellow bars. (b) SERS intensity of 1 μM methylene blue (MB) at 450 cm–1 registered by scaffolds (gelatin + 2% alginate) with varying concentrations of AuNRs, from bare scaffolds (no nanoparticles) to 1000 μM colloidal solution. Error bars show standard deviations from 10 different measurements with three different scaffolds (N = 3, n = 10). (c) SERS intensity of 1 μM MB obtained from scaffolds with 500 μM AuNRs and an increasing alginate percentage up to 2%, (N = 3, n = 10). (d) SERS intensity (at 450 cm–1) as a function of MB concentration. The yellow bar is a linear fit in the quantitative detection regions, including a regression line (dotted line) and 95% confidence interval. Each data point corresponds to the signal from 10 spectra collected from three different scaffolds (N = 3, n = 10). (e) SERS spectra of MB at different concentrations (between 10 nM and 10 μM with 10-fold-increase steps) in cell media, DMEM 10% FBS. (f) SERS intensity of MB (the red line is a linear fit with 95% confidence interval) in the presence of cell media components (N = 2, n = 10). An excitation laser line at 785 nm through a 10× objective, with a power of 15.15 mW for 1 s, was used for all measurements. (g) 3D Z-stack reconstruction of SERS intensity at 450 cm–1 upon MB incubation at 10 μM, recorded with a 785 nm excitation laser through a 20× immersion objective in confocal mode, with a power of 7 mW and 10 ms of integration time.

