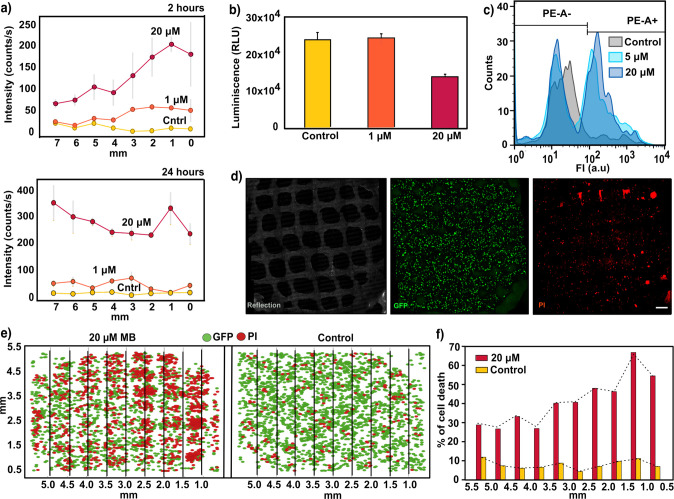
Figure 4.
(a) SERS intensity at increasing doses of MB (control, 1 μM, and 20 μM), registered by scaffolds at different points from the reservoir after 2 h (upper panel) and 24 h (lower panel). Gray lines represent the standard deviation from six spectra (N = 2 samples, n = 3 spectra). An excitation laser at 785 nm through a 10× objective, with a power of 15.15 mW for 1 s, was used for all measurements. (b) Luminescence output 24 h after MB administration monitored with CellTiter-Glo 3D cell viability assay. Error bars indicate the standard derivation of multiple wells measured from the same experiment. (c) Flow cytometry analysis representing quantified single cells labeled with propodium iodide (PI) after treatment with 1 μM and 20 μM MB. The gating indicates the positive and negative cell population after applying a PE emission filter (585/42). (d) Maximum intensity projection (XY) images of a representative live confocal image. 3D cells growing in Matrigel and within the nanocomposite scaffold were labeled with PI for visualizing cytotoxic effects 24 h after dispensing 1 μM MB. Images correspond to a 400 μm thick Z-stack. Scale bar: 500 μm. (e) Two-dimensional representation of the Z-stack projection of 3D live confocal images. Analysis was performed after a 2 h MB treatment to visualize the cytotoxicity gradient. Lines indicate columns into which the images were divided to study the distribution of PI (red) and GFP signals (green). (f) Automated quantification of cell death percentage for control and 20 μM samples, segmented by columns. Dotted line indicates the profile of cell death with the distance.

