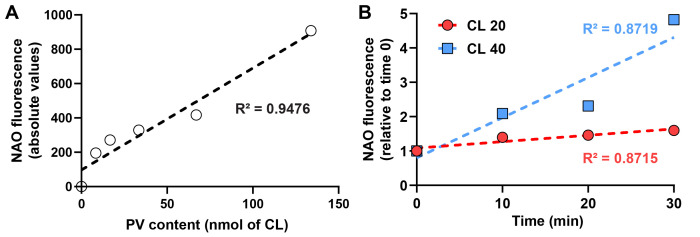
Figure 5. Cardiolipin enrichment and NAO quantification.
A. NAO fluorescence in the presence of varying amounts of PV made of CL. Linear regression is shown in dotted line with respective R fitting. B. NAO fluorescence after fusion of 500 µg of mitochondria with 20 (red) or 40 (blue) nmol of CL vesicles during 0 (control), 10, 20, and 30 min at 30°C. Results are shown relative to the control set to 1.0. Linear regression is shown in dotted line with respective R2 fitting.

