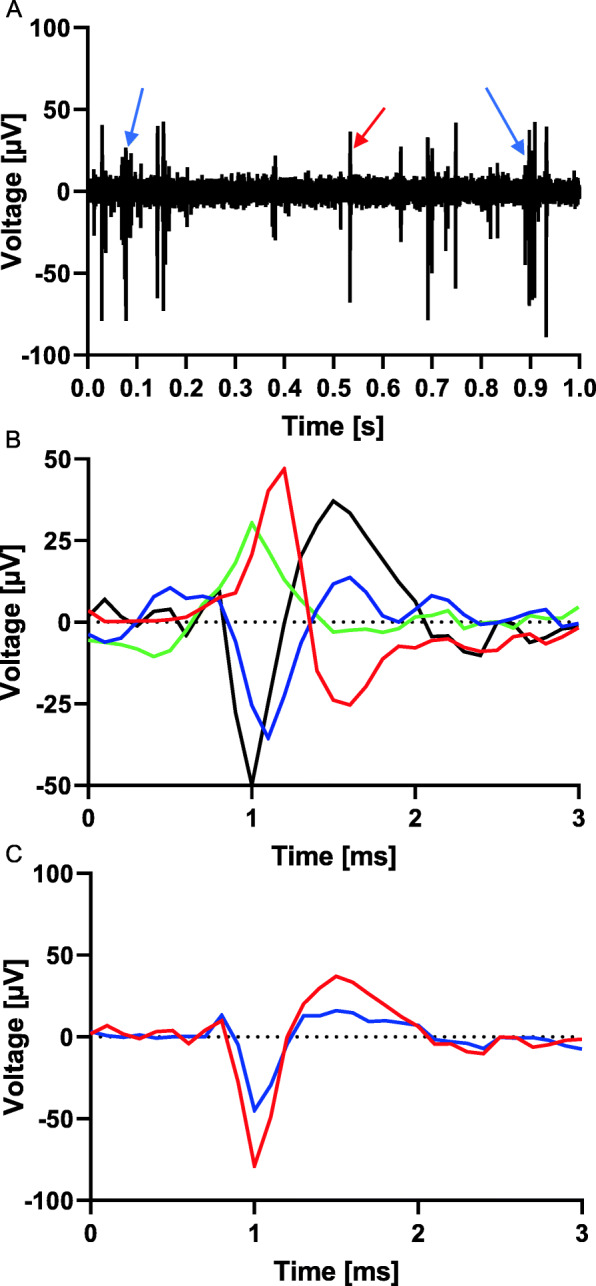
Fig. 2.

Illustration of signals recorded with multielectrode arrays. A One second stream of recording from a single electrode, including single spikes (red arrow) and bursts (blue arrows). B Overlay of single spikes of different waveforms, which suggest different neuronal subtypes as the source. c Overlay of two spikes with different amplitudes but similar waveforms, either indicating different neuronal subtypes or distances of the respective spiking neurons from the recording electrode
