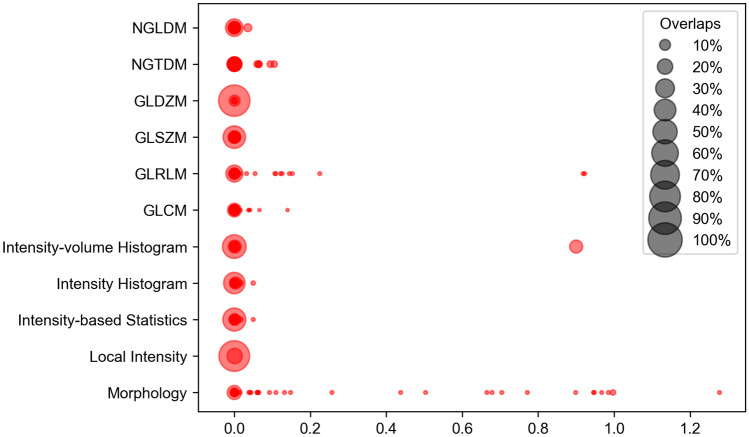
Fig. 7.
Scatter plot for the relative differences, concluding the rest 6 software programs (A1, Pyradiomics, MITK, LIFEX, SERA, A2). Larger size of points indicates that more points are overlapped at the underlying location (e.g., a point with Size 50% means that 50% of points within that feature class are equal). Large points around the location of 0 indicate good agreement across radiomics software programs

