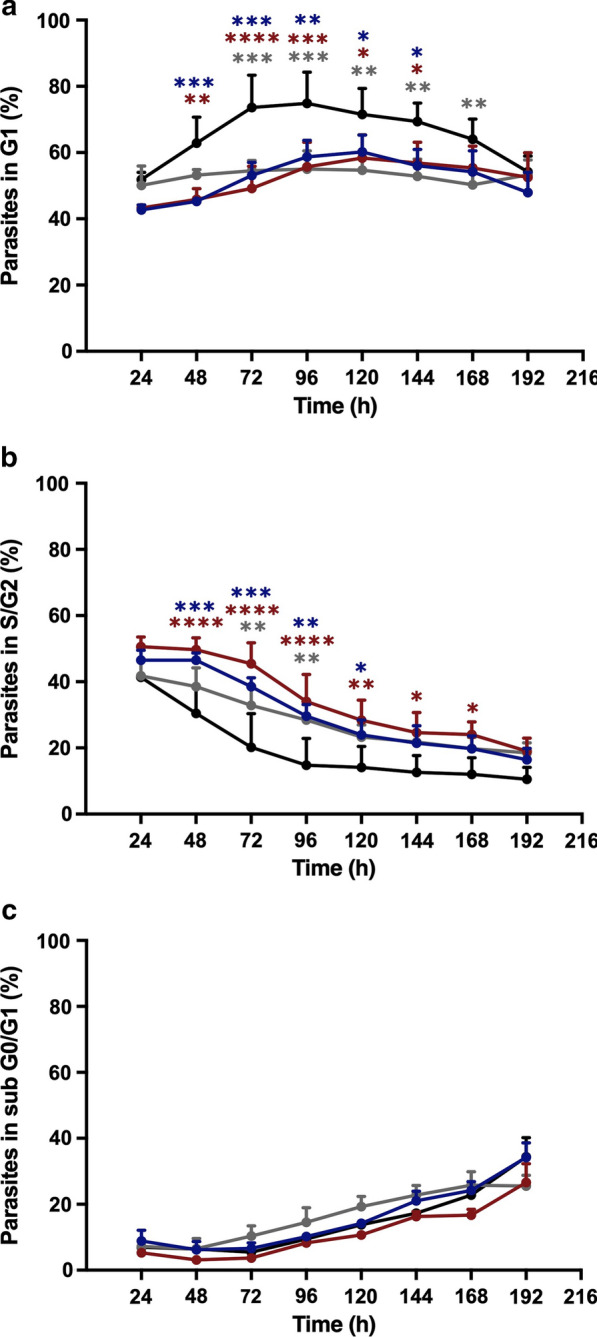
Fig. 6.

The cure-derived isolate revealed cell cycle arrest. The percentages of parasites in the G1 (a), S/G2 (b), and subG0/G1 (c) cell cycle phases are shown. Control isolate curves (IOC-L2335C) are shown in black. Failure-derived samples (IOC-L2371F) are displayed in gray. Resistant isolates selected in vitro (IOC-L2335R) are presented in dark blue in the absence of Sb(III) and in dark red when the media contained 8 µM Sb(III). Three biological replicates were assayed. Dots indicate means, and bars indicate the standard errors. Two-way ANOVA was used followed by Tukey’s HSD post hoc tests for IOC-L2335C. *P < 0.05, **P < 0.01, ***P < 0.001, and ****P < 0.0001
