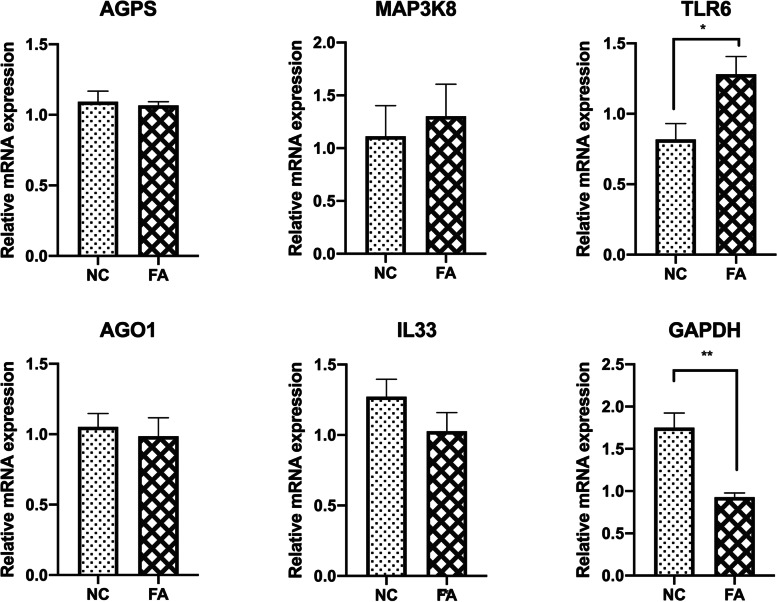
Fig. 2.
The abundance of different transcripts from genes affected by the elevated level of NEFAs (upregulated: AGPS, MAP3K8, and TLR6 and downregulated: AGO1, IL33, and GAPDH) was analyzed by real-time RT-qPCR. The RT-qPCR results showed that MAP3K8, TLR6, AGO1, IL33, and GAPDH had the same direction as in the microarray data, and two of them (TLR6 and GAPDH) showed significant differences relative to the respective controls. * represents p-value < 0.05, ** represents p-value < 0.01. GC samples were analyzed after IVM under the high level of NEFAs throughout the IVM culture or control treatment. NC is the control group, and FA is the group exposed to the elevated level of NEFAs. AGPS: Alkylglycerone Phosphate Synthase; MAP3K8: Mitogen-Activated Protein Kinase Kinase Kinase 8; TLR6: Toll Like Receptor 6; AGO1: Argonaute RISC Component 1; IL33: Interleukin 33; GAPDH: Glyceraldehyde-3-Phosphate Dehydrogenase

