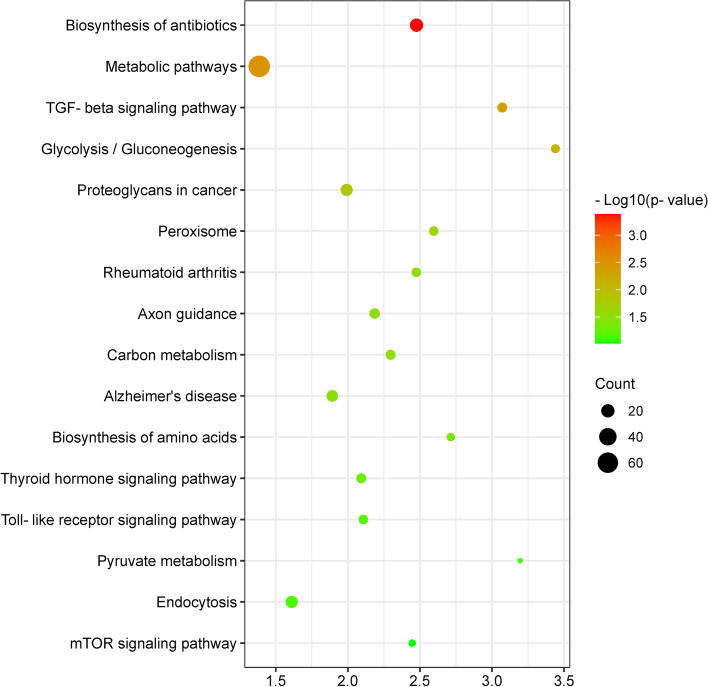
Fig. 5.
Bubble chart of potential signaling pathways generated by KEGG. Pathway analysis was performed to associate the unique DEGs with pathways using the KEGG database. The size and color of each bubble represent the number of DEGs in the pathway and the P-value, respectively. Fold enrichment was calculated as the ratio of genes (the number of genes from the dataset enriched in the pathway in question divided by all the genes from the dataset) divided by the ratio of background (the number of annotated genes from the background enriched in the pathway in question divided by all annotated genes from background)

