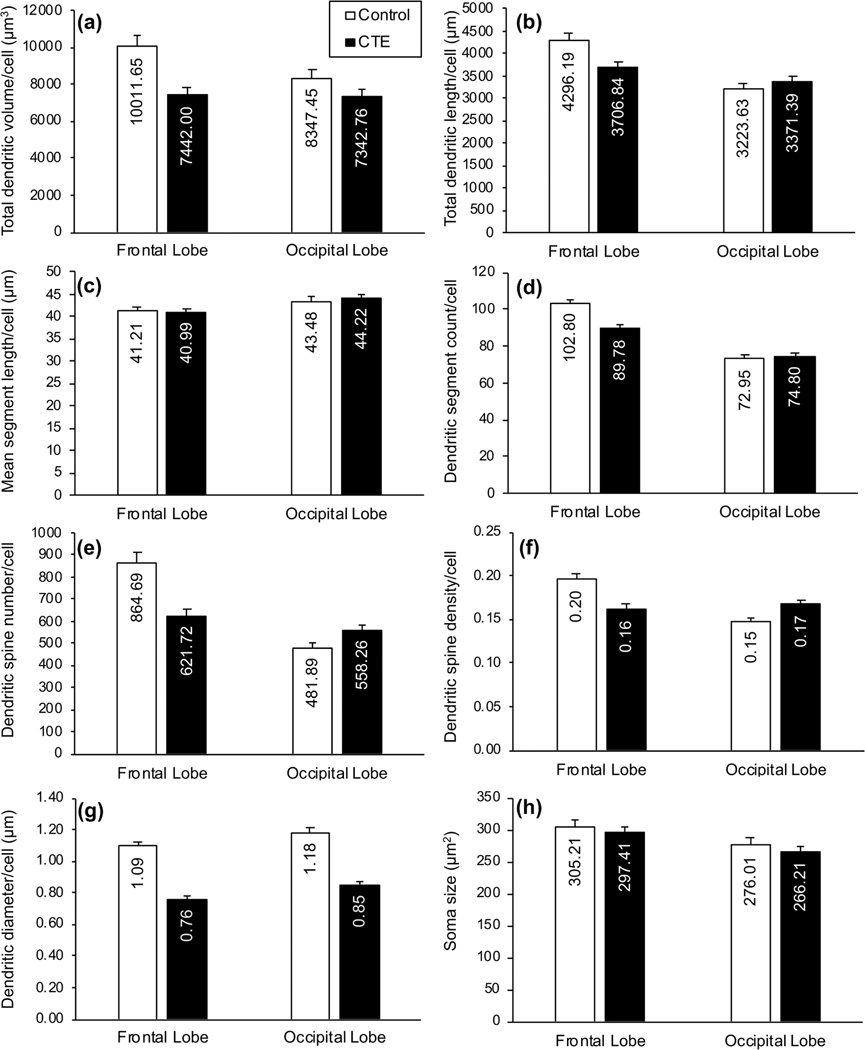
FIGURE 4.
Bar graphs showing differences in dendritic measures between groups (Control, chronic traumatic encephalopathy [CTE]): (a) total dendritic volume (Vol in μm3); (b) total dendritic length (TDL, in μm); (c) mean segment length (MSL; in μm); (d) dendritic segment count (DSC); (e) dendritic spine number (DSN); (f ) dendritic spine density (DSD; number of spines/μm of dendritic length); (g) dendritic diameter (Dia, in μm); and (h) soma size (in μm2). In the Control group, with the exception of MSL, all dependent dendritic and spine measures appeared to be higher in the frontal lobe than the occipital lobe. Regional differences in the CTE group were variable across measures. Between the two groups, Vol and Dia measures were lower in the CTE group than in the Control group for both regions, but TDL, DSC, DSN, and DSD were lower in the CTE group in the frontal lobe only. Only small differences in soma size between groups and regions were noted. Error bars represent SEM

