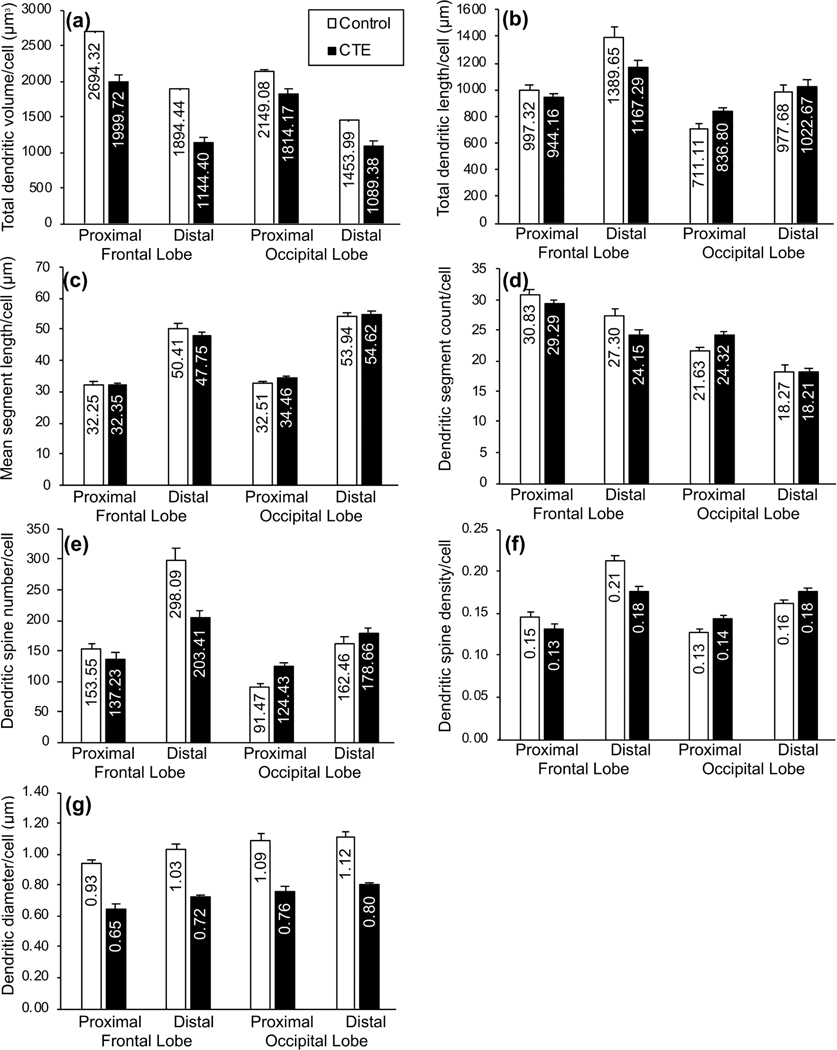
FIGURE 6.
Bar graphs showing differences in dendritic measures between groups (Control, chronic traumatic encephalopathy [CTE]) and between basilar dendritic segments (proximal, distal): (a) total dendritic volume (Vol; in μm3); (b) total dendritic length (TDL, in μm); (c) mean segment length (MSL; in μm); (d) dendritic segment count (DSC); (e) dendritic spine number (DSN); (f) dendritic spine density (DSD; number of spines/μm of dendritic length); and (g) dendritic diameter (Dia, in μm). Within-groups, with the exception of DSC and Vol, proximal segment measures were lower than distal segment measures in both regions. In the frontal lobe, between-group differences in Vol, TDL, DSC, DSN, and DSD were relatively greater in distal segments than in proximal segments. Discrepancies in proximal and distal measures between groups in the occipital lobe were not consistent across measures. Error bars represent SEM

