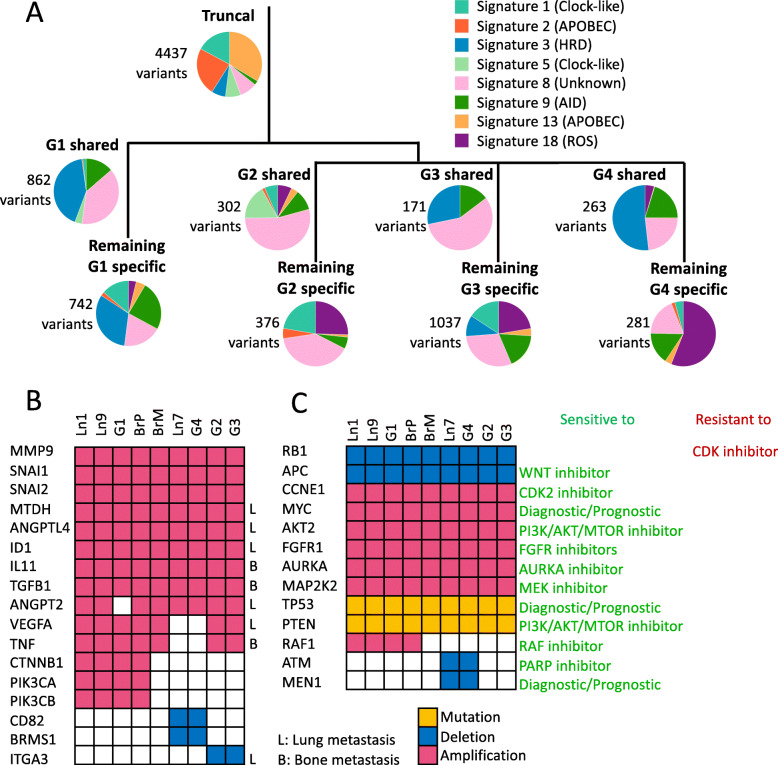
Fig. 5.
Temporal and spatial distribution of mutational signatures, mutated metastasis-related genes, and clinically actionable genes. A Genome-wide mutational signatures exhibited at different stages of tumor evolution, annotated to the phylogenetic tree. The number of variants is labeled beside each pie chart. HRD homologous recombination deficiency. ROS reactive oxygen species. B Distribution of metastasis-related mutations across genes and samples. Genes that are involved in lung metastasis labeled L; genes that are involved in bone metastasis labeled B. C Distribution and type of potentially clinically informative mutations across genes and samples. Gene mutations are shown in yellow, deletions in blue, and amplifications in red

