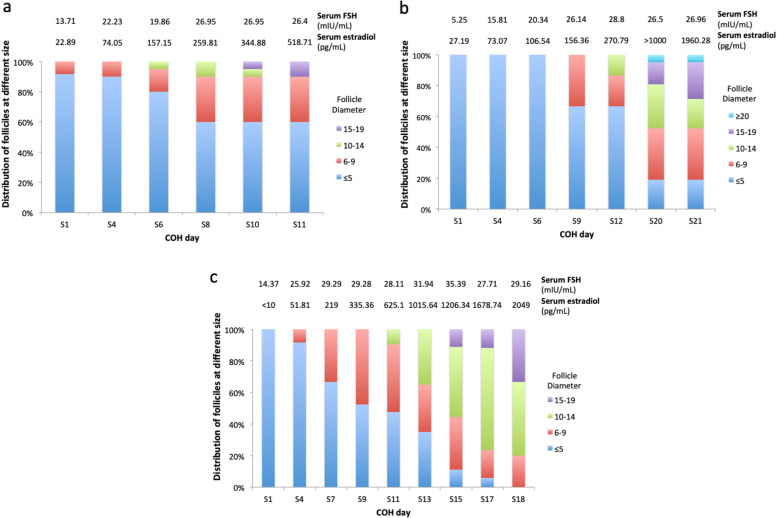
Fig. 1.
Follicular growth under controlled ovarian hyperstimulation (COH) showing the relationship between serum FSH level and follicular response as well as the corresponding serum estradiol level. Follicles are divided into 5 groups: ≤5 mm, 6-9 mm, 10-14 mm, 15-19 mm, ≥20 mm. Percentage of each group is shown. S1 = Day 1 of hyperstimulation. a Patient 1's second COH cycle; b Patient 2's first COH cycle, note that no exact estradiol reading was recorded on S20 because the corresponding serum sample was not diluted; c Patient 2's second COH cycle

