Fig. 2.
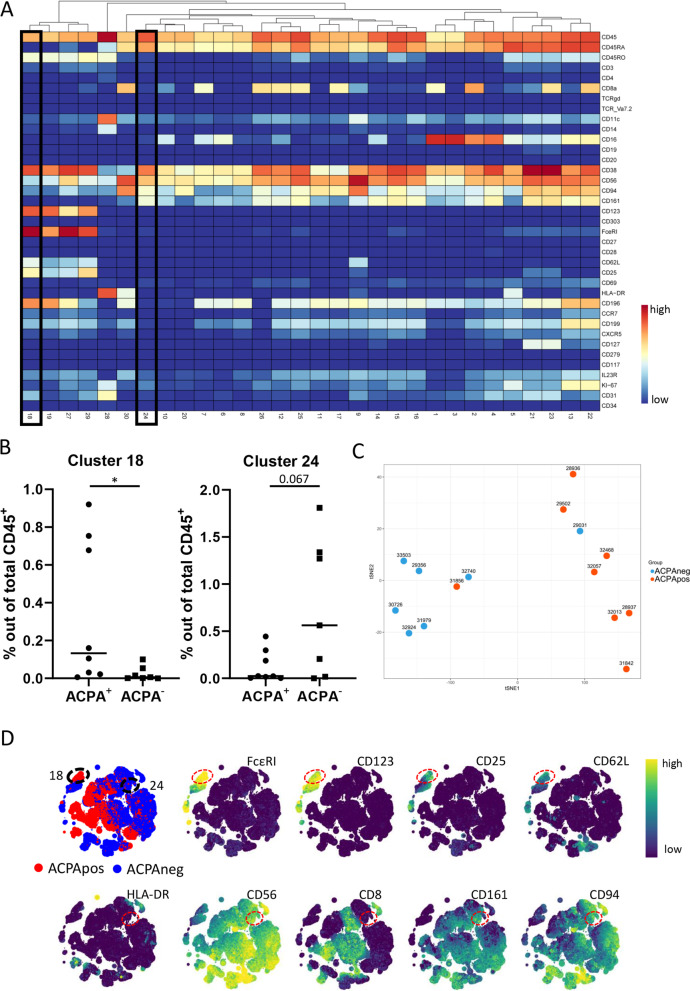
HSNE analysis of all innate subsets indicated differences in basophil and NK cell subsets. A Heatmap representing all clusters within the innate population and their respective expression patterns, cluster 18/24 indicated with black boxes. B Cluster 18 (basophil subset, p = 0.033) was reduced in ACPA− patients and there was a strong trend for cluster 24 (NK cell subset p = 0.063) present only in ACPA− patients (Cytofast). C tSNE plotting samples using clusters 18 and 24 as input confirmed the separation shown in B. D HSNE map indicating cluster 18 and cluster 24 (dashed circles) and examples of the expressed markers. ACPA+ in red, ACPA− in blue

