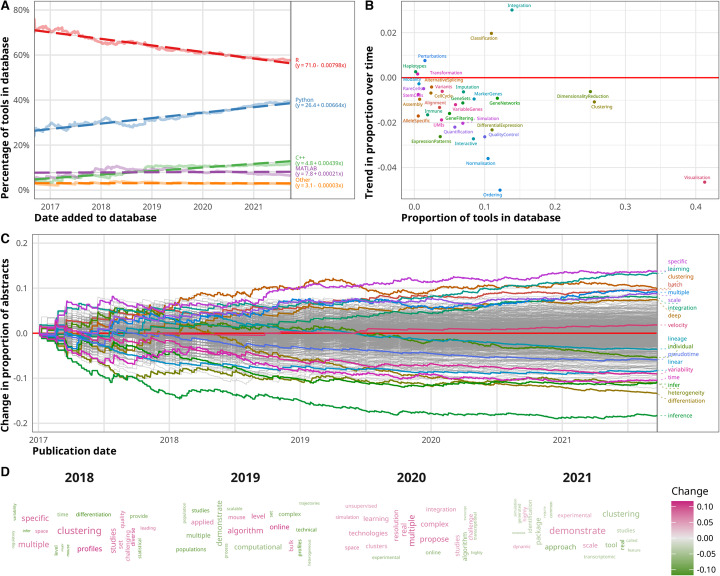
Fig. 2.
Trends in scRNA-seq analysis tools. A Line plot of platform usage of tools in the scRNA-tools database over time. Python usage has increased over time while R usage has decreased. Darker dashed lines show linear fits with coefficients given in the legend. B Scatter plot of trends in scRNA-tools analysis categories over time. The current proportion of tools in the database is shown on the x-axis, and the trend in proportion change is shown on the y-axis. C Line plot of trend in word use in scRNA-seq analysis tool publication abstracts over time. Publication date is shown on the x-axis and change in the proportion of abstracts containing a word on the y-axis. Some important and highly variable terms are highlighted. D Word clouds of abstract terms by year. Word size indicates the proportion of abstracts that included the term in that year. The color of words shows the change in proportion compared to the previous year with pink indicating an increase and green indicating decreases. The 20 words with the greatest change in proportion are shown for each year

