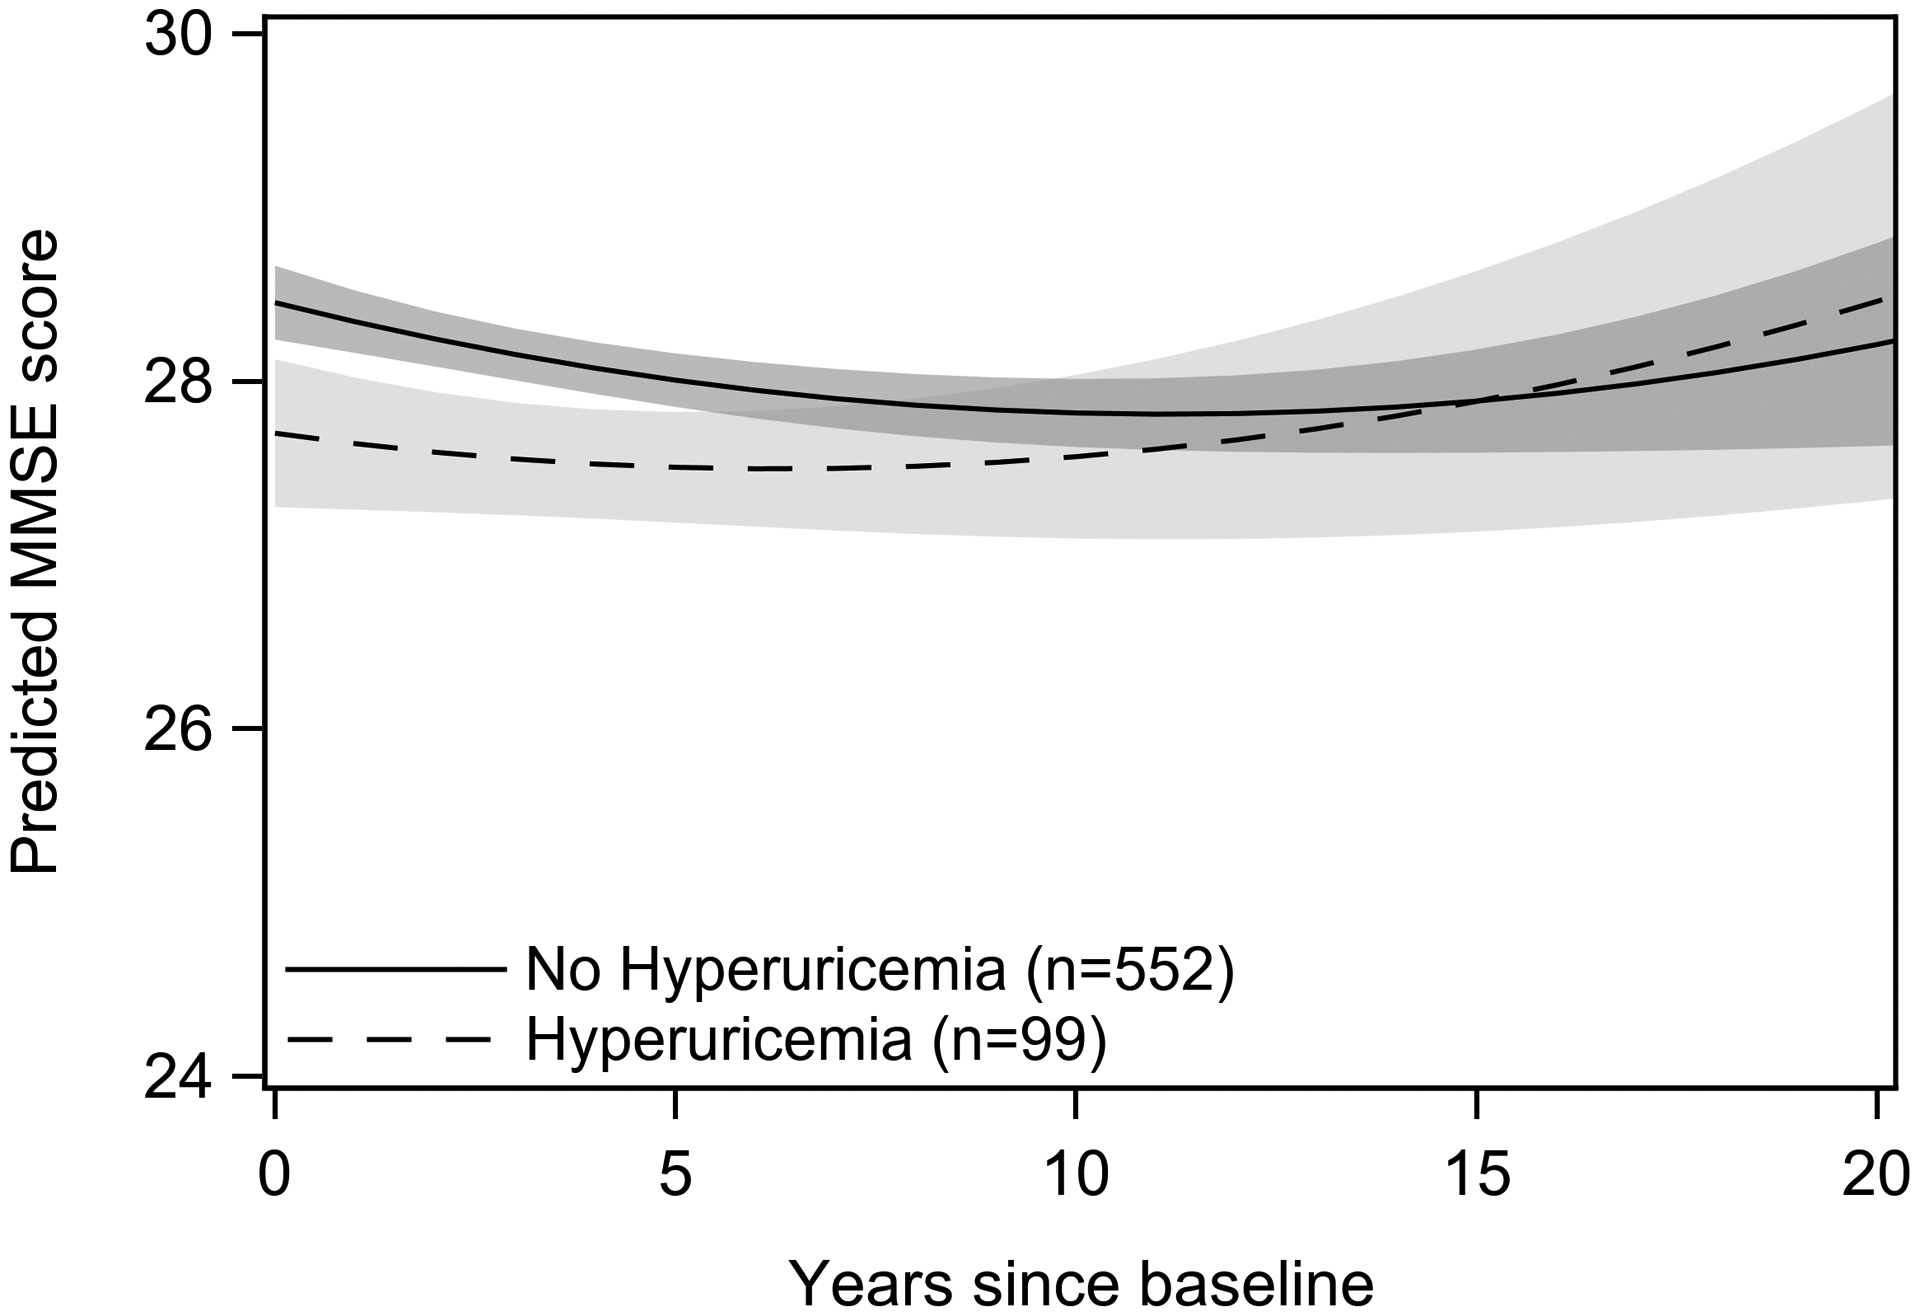
Figure 3.

Modeled trajectories of MMSE performance over time as a function of hyperuricemia status in men. Plots are based on model coefficients using group-specific mean values for covariates: age and education. Trajectories are plotted to 20 years follow-up time, the 95th percentile of follow-up time for the study population.
