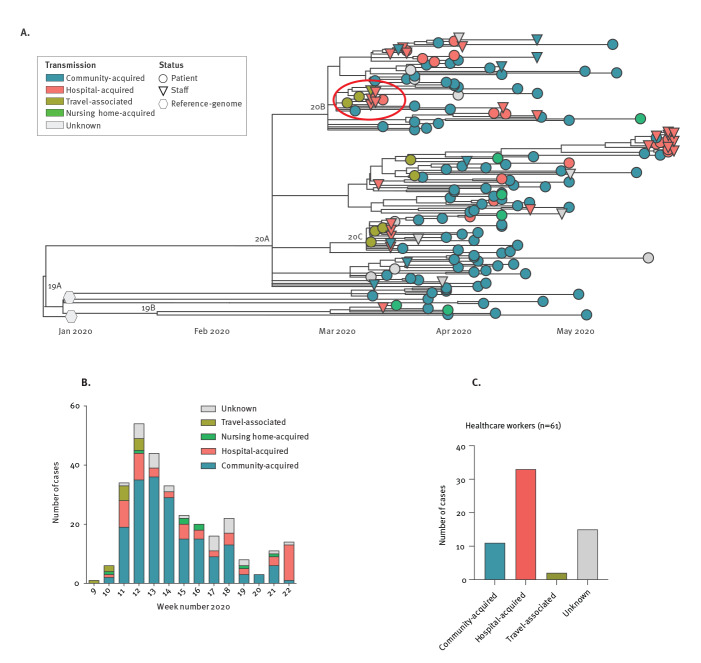
Figure 3.
Local phylogenetic relationship of SARS-CoV-2 genomes and transmission dynamics, Munich Metropolitan Region, February–May 2020 (n = 289)
SARS-CoV-2: severe acute respiratory syndrome coronavirus 2.
A. The phylogenetic relationship of SARS-CoV-2 genomes obtained in this study from HCW (n = 39, circles) and patients (n = 135, triangles) are shown in a maximum likelihood time-resolved phylogenetic tree in relation to two reference genomes from Wuhan, China (Wuhan/WHO1/2019 and Wuhan/Hu-1/2019, hexagons). Presumable transmission modes are indicated by tip colours. Nextstrain nomenclature clades are indicated above the main branches. The red ellipse indicates the sequences of the cluster of cases that is investigated further in Figures 4 and 5.
B. The most likely mode of SARS-CoV-2 transmission is indicated for all cases (n = 289), from the first case on 26 February 2020 (week 9) until 27 May 2020 (week 22).
C. The overall proportion of presumable transmission modes are indicated for patients and HCW.

