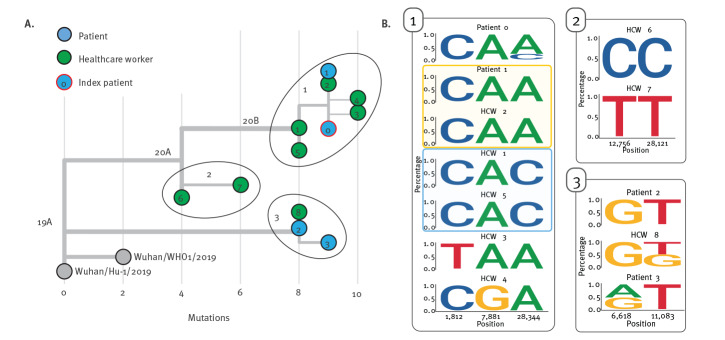
Figure 5.
Investigation of nosocomial SARS-CoV-2 transmission clusters using genomic epidemiology Munich, February–May 2020 (n = 12)
SARS-CoV-2: severe acute respiratory syndrome coronavirus 2.
A. Maximum likelihood phylogeny of SARS-CoV-2 sequences from HCW (green circles), patients (blue circle) and the index person (Patient 0, blue with red border) involved in this outbreak in relation to two reference genomes from Wuhan, China. The number of mutations in relation to the reference sequence Wuhan/Hu-1/2019 is shown on the x-axis. Sequences are divided in three groups: (i) Sequences from five HCW (green circles, 1–5) and one patient (blue circles, Patient 1) that are similar to the sequence of the index case (blue circle with red border, Patient 0). (ii) Two sequences from HCW 6 and 7 that turned out not to be related to the index case, Patient 0. (iii) A smaller separate cluster was identified consisting of HCW 8 and two patients (Patient 2 and Patient 3) that were infected in a nursing home.
B. For each group, minority allele variants are represented by sequence logos showing the variant frequency calls as proportionally sized nucleotide letters. Nucleotide positions are indicated in relation to the reference genome Wuhan/Hu-1/2019 (GenBank accession number: MN908947.3).

