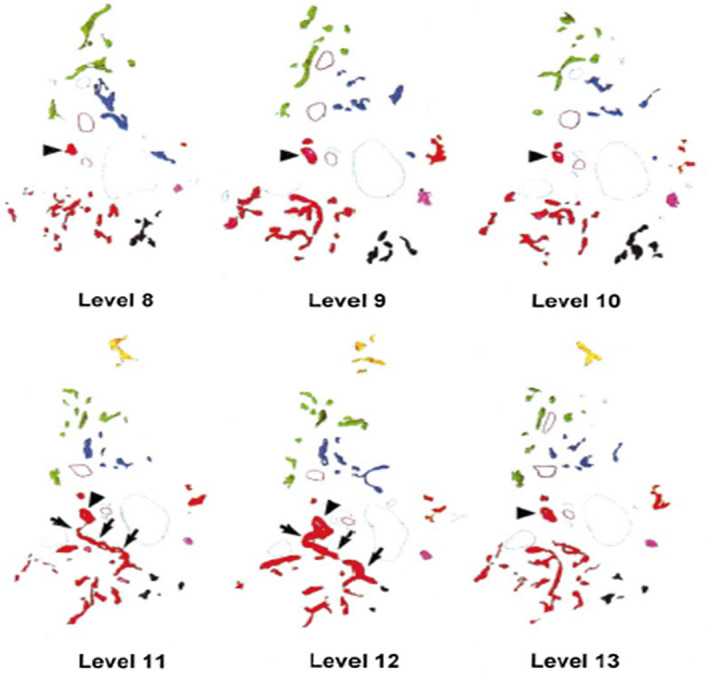
FIG 13.

Six sample tracings of CK19‐positive DRs in sequential levels around a single portal tract. Colors are assigned to indicate contiguity of structures when analyzed in three dimensions. On each level, one BD is marked by an arrowhead. Note in levels 11 and 12 that the red arborizing structure connects via a single branch to this BD (arrows). Reproduced with permission from Hepatology. 3 Copyright 1999, American Association for the Study of Liver Diseases.
