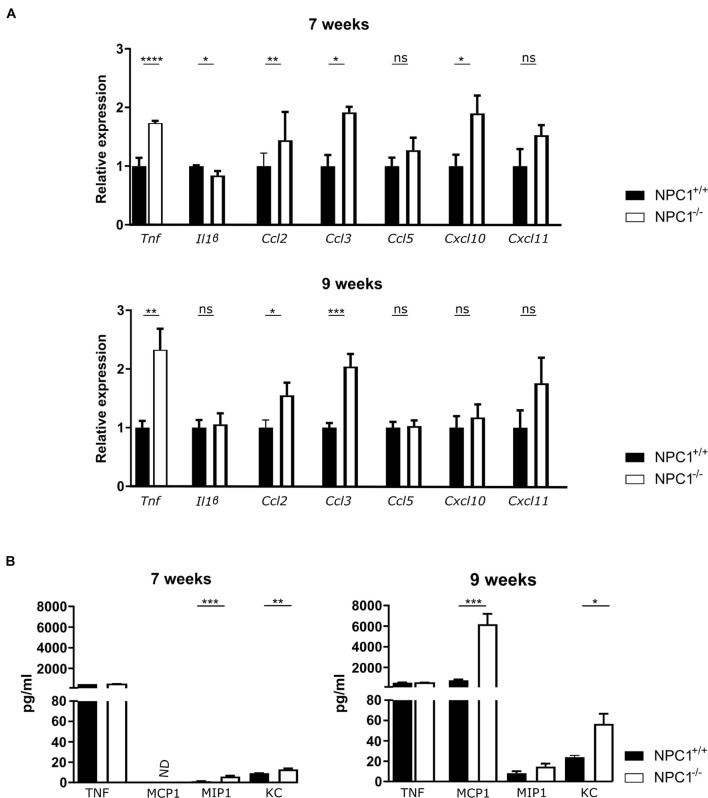
FIGURE 1.
Increased cytokine and chemokine levels in the choroid plexus and CSF of NPC1–/– mice. (A) qRT-PCR analysis of choroid plexus isolated from NPC1+/+ (n = 11; black) and NPC1–/– (n = 13; white) of 7 and 9 weeks old mice. Results are represented relative to the NPC1+/+ condition. (B) Bioplex analysis of protein levels in CSF from NPC1+/+ (black) and NPC1–/– (white) mice (n = 5). Data are shown as mean ± SEM. Statistical analyses on datasets were performed by Mann–Whitney test. Asterisks indicate statistical significance (*p < 0.05, **p < 0.01, ***p < 0.001, ****p < 0.0001, ns: non-significant). ND: not detected.

