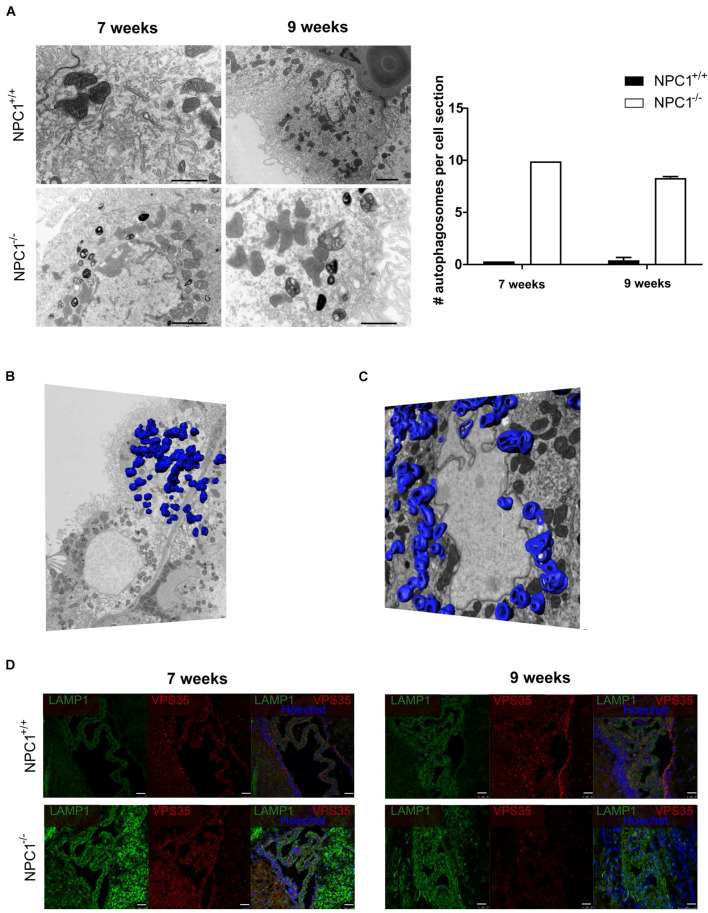
FIGURE 3.
NPC1–/– mice show a huge increase in autophagosomes in the choroid plexus epithelial cells. (A) Representative transmission electron microscopy (TEM) images of choroid plexus epithelial cells of the fourth ventricle of NPC1+/+ and NPC1–/– mice (7 and 9 weeks old). Scale bar represents 10 μm. The graph represents the amount of autophagosomes per cell section in 7 and 9 weeks old NPC1+/+ (black) and NPC1–/– (white) mice (n = 3). (B) Representative serial block face scanning electron microscope (SBF-SEM) snapshot of Supplementary Video 1 of a choroid plexus epithelial cell of the fourth ventricle of a 9 weeks old NPC1–/– mouse. The autophagosomes are traced on the different sections and visualized in blue (n = 1). (C) Representative focused ion beam scanning electron microscopy (FIB-SEM) snapshot of Supplementary Video 2 of a choroid plexus epithelial cell of the fourth ventricle of a 9 weeks old NPC1–/– mouse. The autophagosomes are traced on the different sections and visualized in blue (n = 1). (D) Representative images of LAMP1 staining (green) and VPS35 (red) of the choroid plexus of the fourth ventricle of NPC1+/+ and NPC1–/– mice of 7 and 9 weeks old. Cell nuclei are counterstained with Hoechst (blue) (n = 4–5). Scale bar represents 25 μm.

