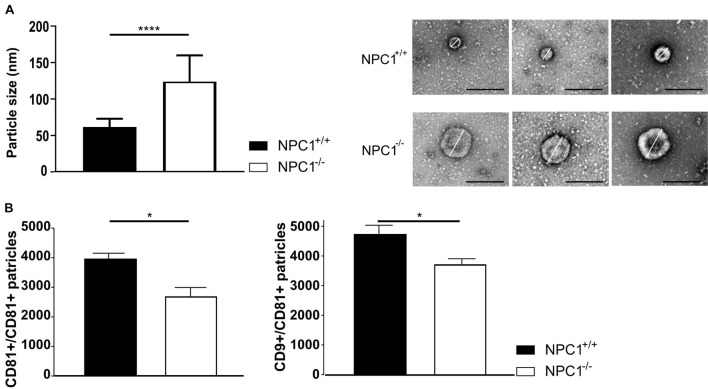
FIGURE 4.
NPC1–/– mice contain larger and less CSF extracellular vesicles (EVs). (A) Average size and representative negative staining transmission electron microscopy (TEM) images of CSF EVs from 9 weeks old NPC1+/+ (black; n = 30) and NPC1–/– (white: n = 30) mice. Scale bar represents 500 nm. The size represents the mean ± SEM of 30 EVs per condition. (B) ExoView analysis of the amount of CD81 captured and CD9 captured–CD81 positive EVs in CSF of NPC1+/+ and NPC1–/– mice of 9 weeks old mice. Bar represent mean ± SEM of four biological replicates. For each biological replicate, the presented result is the average from three technical replicates on the chip. Data are shown as a mean ± SEM. Statistical analyses on datasets were performed by Mann–Whitney test. Asterisks indicate statistical significance (*p < 0.05 and ****p < 0.0001, ns: non-significant).

