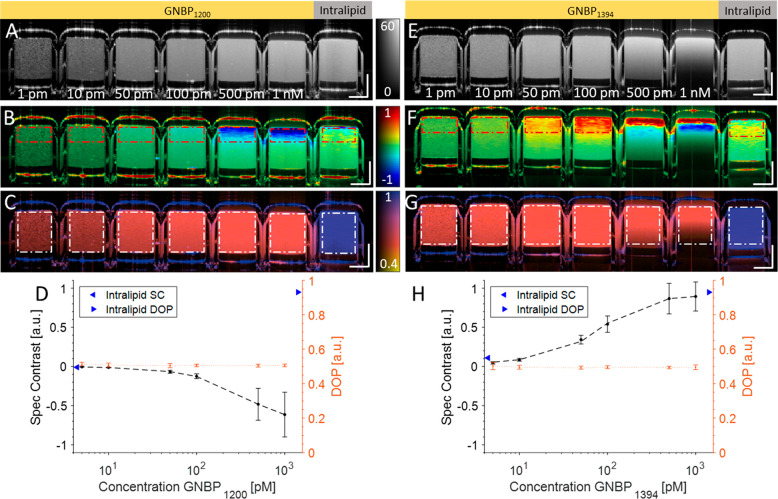
Figure 2.
(A) Intensity, (B) spectral contrast, and (C) DOP of a dilution series of GNBP1200 (1 nM, 500 pM, 100 pM, 50 pM, 10 pM, and 1 pM) and 1% intralipid control. (D) Quantification of spectral contrast and DOP exhibited by the control and GNBP1200 within the red and white ROIs, respectively. (E–G) Intensity, spectral contrast, and DOP of GNBP1394 and 1% intralipid. (H) Quantification of spectral contrast and DOP from GNBP1394 within the red and white ROIs, respectively. Scale bars: 250 μm. The intensity is on the dB scale. SC color scale: −1 to 1. DOP: 0.4 to 1.

