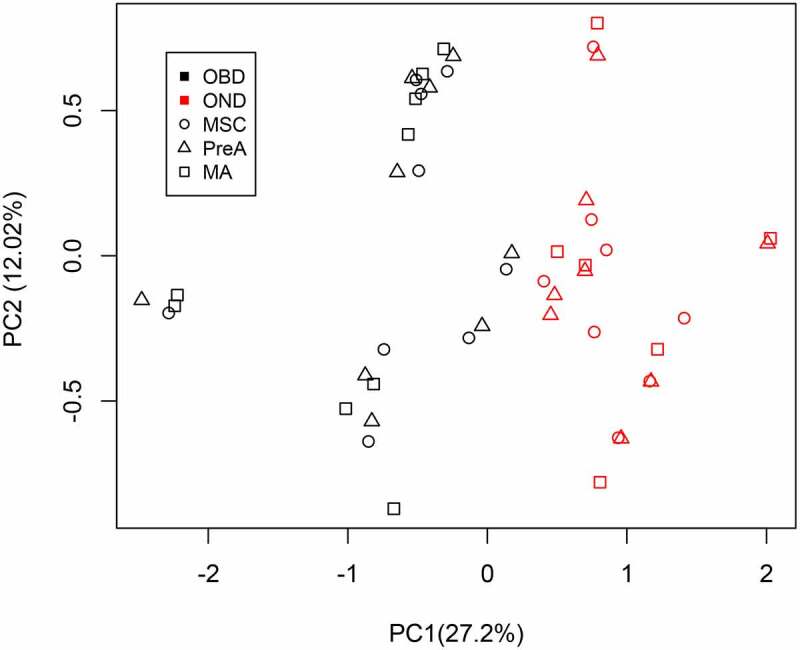
Figure 3.

PCA analysis results, based on 115 persistent DMCs, among OD (red symbols) and OND (black symbols) samples. DMC: differential methylation CpG site; OD: samples from obese patients with diabetes; OND: samples from obese patients without diabetes
