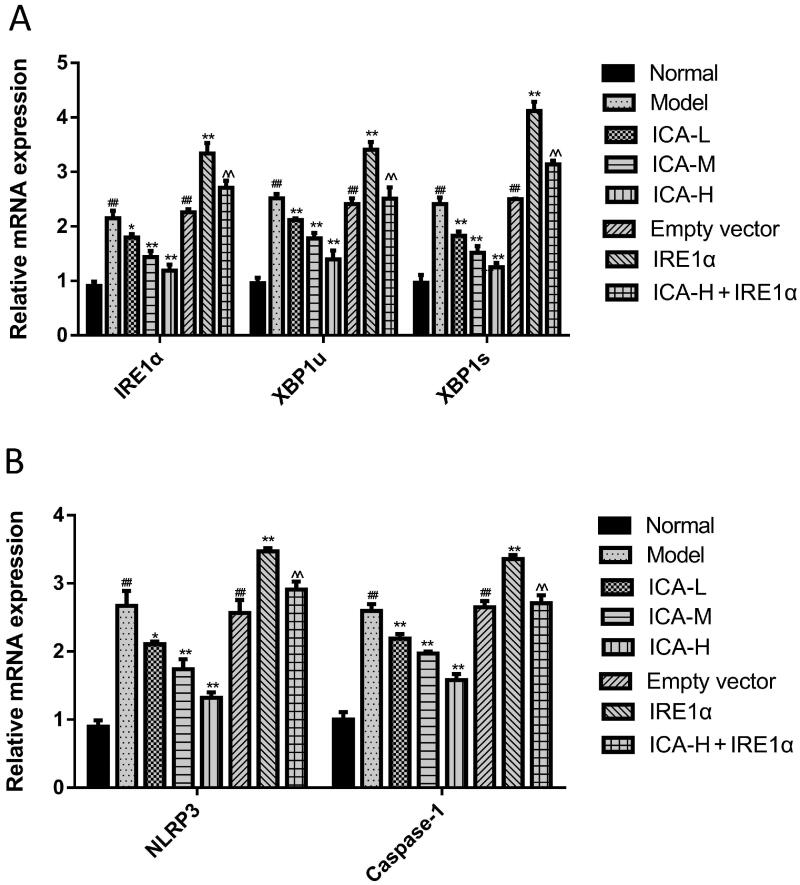
Figure 3.
ICA reduced the mRNA expression of IRE1α/XBP1 inflammatory signal axis induced by OGD/R. Microglia were subjected to 2 h of OGD followed by 24 h reoxygenation. ICA (0.37, 0.74 and 1.48 μmol/L) administration was performed 1 h prior OGD and maintained 2 h throughout OGD. IRE1α, XBP1u, XBP1s, NLRP3 and caspase-1 mRNA expression was assayed by qRT-PCR. Data are expressed as mean ± SD of three independent experiments. ##p< 0.01 vs. normal control group; *p< 0.05, **p< 0.01 vs. OGD/R group; ^^p< 0.01 vs. ICA-H group. ICA-L: 0.37 μmol/L ICA, ICA-M: 0.74 μmol/L ICA and ICA-H: 1.48 μmol/L ICA.

