
Fig. 1.
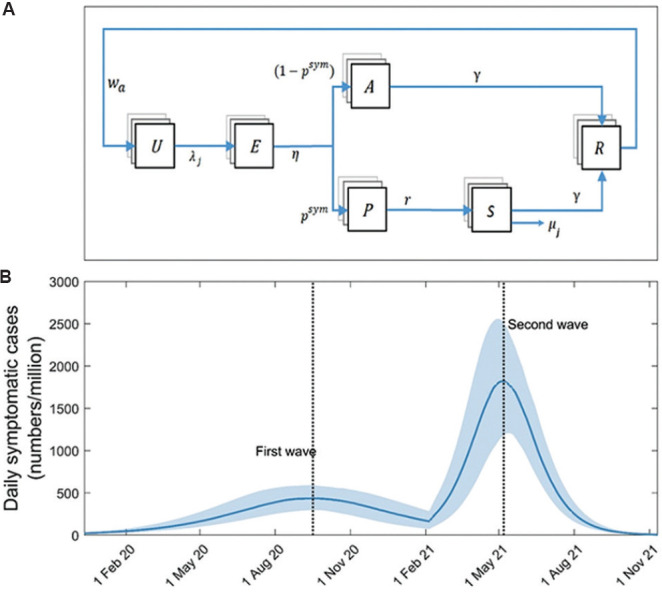
Model structure and approach. (A) Schematic illustration of the model structure. Boxes show states representing different stages in the natural history of SARS-CoV-2 infection, while arrows show flows between these states, as a result of infection, recovery, etc. U, uninfected; E, exposed (latent infection); P, presymptomatic; A, asymptomatic; S, symptomatic; R, recovered and immune. Model parameters are as listed in Table S1. (B) Modelled first and second waves of COVID-19 in India. As described in the main text, these dynamics arise from assuming the emergence of a virus with R0=1.2 in a fully susceptible population (first wave), and then the subsequent emergence of a virus with R0=2.2, to which those with prior exposure remain immune (second wave).